Download
1 / 10
100 likes | 229 Views
Nonlinear Models. Learning Example: knnl533.sas. Y = relative efficiency of production of a new product (1/expected cost) X 1 : Location A : X 1 = 1, B: X 1 = 0 X 2 = time (weeks) n = 30. Learning Example: input. data learning; infile 'I:My DocumentsStat 512CH13TA04.DAT' ;

E N D
Learning Example: knnl533.sas Y = relative efficiency of production of a new product (1/expected cost) X1: Location A : X1 = 1, B: X1 = 0 X2 = time (weeks) n = 30
Learning Example: input data learning; infile'I:\My Documents\Stat 512\CH13TA04.DAT'; input x1 x2 y; label x1 = 'Location' x2 = 'Week' y = 'Efficiency'; procprintdata = ch13tab04; run;
Learning Example: Interaction plot title1'Plot of the data'; symbol1v = ‘B'i = nonec = blue; symbol2v = ’A'i = nonec = red; procgplotdata = learning; plot y*x2 = x1; run;
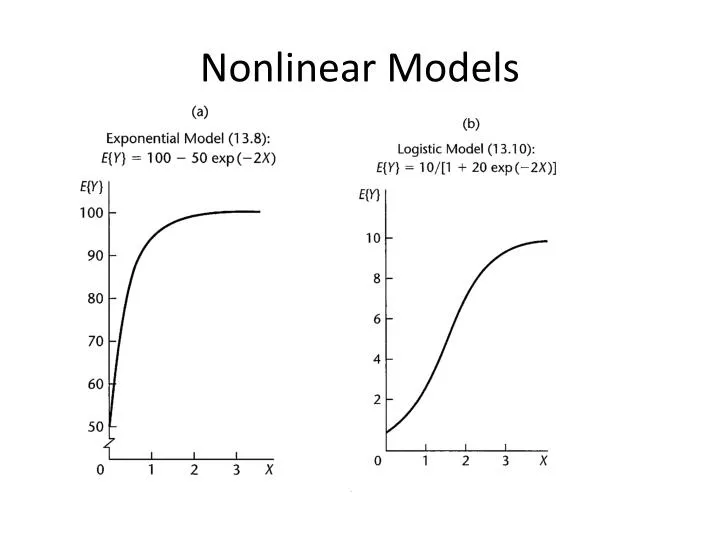
Learning Example: Model procnlindata = learning method = newton; parms g0=1.025 g1=-0.0459 g2=-0.5 g3=-0.122 ; model y = g0 + g1*x1 + g2*exp(g3*x2); outputout = nlinoutp = pred; run; The NLIN Procedure Dependent Variable y Method: Newton
Learning Example: Fitted Data datanlinout; setnlinout; if x1 = 0thendo; y1 = y; z21 = x2; p1 = pred; end; if x1 = 1thendo; y2 = y; z22 = x2; p2 = pred; end; run; symbol1v = 'B'i = nonec = blue; symbol2v = 'A'i = nonec = red; symbol3v = nonei = join c = blue; symbol4v = nonei = join c = red; procgplotdata = nlinout; plot y1*z21 y2*z22 p1*z21 p2*z22/overlay; run;