Download
1 / 23
230 likes | 313 Views
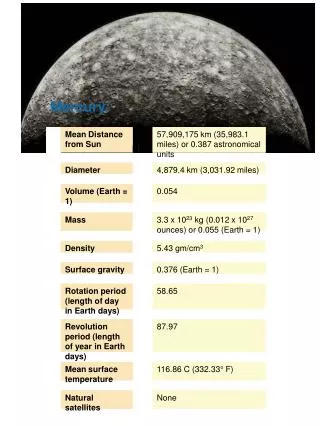
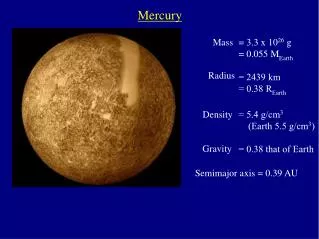
Mercury at the TNG. Cesare Barbieri Dept. of Astronomy University of Padova cesare.barbieri@unipd.it. With the collaboration of: Gabriele Cremonese, Stefano Verani, Valeria Mangano and Francois Leblanc. Mercury’s Exosphere with the TNG.

E N D
Mercury at the TNG Cesare Barbieri Dept. of Astronomy University of Padova cesare.barbieri@unipd.it With the collaboration of: Gabriele Cremonese, Stefano Verani, Valeria Mangano and Francois Leblanc Boston Meeting
Mercury’s Exosphere with the TNG Our program to observe with the High Resolution Spectrograph (SARG) of the TNG started in 2002. The observing period is very short, less than 60 min (only at sunset). • Four TNG campaigns: • - 2002 (Barbieri et al. PSS, 2003) • 2003 (Leblanc et al. Icarus, 2006) • we could not observe in 2004 • 2005 (Mangano et al. EGU 2006) • 2006 (June in preparation, bad weather in October) Boston Meeting
SARG Characteristics SARG main parameters A Na-D 60 A wide filter is inserted before the slit to suppress unwanted orders, so we imagine 0.32x27 arccsec in the sky. Boston Meeting
From raw to reduced Subtract background and scattered light Extract the Na-D emissions Fit a Voigt profile Boston Meeting
Two examples from 2005 July 1, 2005 June 29, 2005 The slit was kept aligned in Right Ascension. The Na measured counts (ADUs) along the slit. Boston Meeting
Radial velocity verification Topocentric Radial velocity of Na-D emissions. Table from the 2002 data. The precision is slightly worse than expected, but until now we didn’t try to do a better analysis. Boston Meeting
PROBLEMS! • Slit position • Hapke’ method and physical calibration • Background substraction ??, electronics instabilities associated with dome opening?? Boston Meeting
Problems with slit position One of our major present difficulties is the determination of the slit position on Mercury’s disk. The slit field is imaged by a TV camera that takes an image every 0.1 seconds or so, and which is positioned after the NaD narrow filter. So, we could obtain at the same time useful planet’s images. Unfortunately, the slit plane has no good optical qualty, as shown here: An image obtained in 2003 An image obtained in 2006 The situation has been slightly improved in 2006 with a new TV camera, but a drastic remedy is necessary. We are trying to have a better slit for next run. On the data obtained till now ,we cannot claim a positioning accuracy better than 1” ( 1/6th Mercury radii). Boston Meeting
Problems with scattered background We are obliged to observe only in the evening. Therefore, we start the observations when the Sun is still several degrees above the horizon. The dome has fairly reflective walls very close to the telescope. Even raising the perforated wind screen has little effect on a strong rapidly varying background. Sometimes we are even forced to start observing with the domeshutters only partially open. Therefore, the background level of the first images is sometimes erratic and difficult to remove from the data. As a consequence, the absolute calibration of the brightness of the lines via Hapke’s method is very uncertain on the earliest spectra. The problem seems aggravated in 2005 and 2006 data. Boston Meeting
Applying Sprague et al. (1997) Method By fitting the theoretical Hapke’s continuum, the Na-D intensities are calibrated in Rayleigh. The original program was obtained from A. Sprague, and recently modified by F. Leblanc. • Systematic search of an optimum for two free parameters: • position of the slit on the disk ( 1”.5 from the theoretical position) • seeing values (between 0”.7 and 2”.5) Boston Meeting
Results for the June 16, 2006 evening - 1 Boston Meeting
Results for the June 16, 2006 evening - 2 D2 Log10 scale 46,55 44,48 For better visual clarity, I show only the D2 intensities. Boston Meeting
Results for the June 16, 2006 evening - 3 Comparison of the measured emission (ADU) at different positions D1 D2 Difference due to dome? No change Boston Meeting
Results for the June 17, 2006 evening - 1 Boston Meeting
Log10 scale Results for the June 17, 2006 evening - 2 43, 61, 63, 65 41, 42, 49, 47, 51, 53, 54 62, 66 For better visual clarity, I show only the D2 intensities Boston Meeting
Results for the June 17, 2006 evening - 3 Comparison of the measured emission (ADU) at different positions D2 (same behavior for D1) No change No change Same position No change Change due to dome ? Boston Meeting
Results for the June 18, 2006 evening - 1 Bad Night!! Boston Meeting
Results for the June 18, 2006 evening - 2 Log10 scale 47, 50 The slit was rotated in the celestial declination direction, and spectra taken across the disk, in front to the planet and in the anti-Sunward direction. For better visual clarity, only the D2 intensities are shown. Boston Meeting
Results for the June 18, 2006 evening - 3 Comparison of the measured emission (ADU) at different positions D1 and D2 Dome effect? Boston Meeting
Results for the June 19, 2006 evening - 1 Boston Meeting
Results for the June 19, 2006 evening - 2 Log10 scale 46, 54, 55 56, 57 The slit was rotated in the equatorial declination direction, and spectra taken across the disk, in front to the planet and in the anti-Sunward direction. Only D2 is shown. 44, 45, 48, 51, 61 Boston Meeting
Results for the June 19, 2006 evening - 3 Comparison of the measured emission (ADU) at different positions D2 Same position Boston Meeting
CONCLUSIONS 2006 • Excellent data of the sodium emissions for three nights 06/16/06 06/17/06 06/19/06 ( the 06/18/06 not very good) • Problem of calibration has to be solved • Analysis of the Doppler shift of the emission lines to be refined: at moment, no good precision on the radial component, pixel dispersion ~1 km/s: when divided by phase angle this dispersion is equal to 10 km/s on the radial velocity during the two first nights (Phase Angle 94° and 96°), down to 7 km/s for the two last nights (Phase Angle 98° and 100.6°), whereas the expected velocity range in the tail is between 0 and 12 km/s Boston Meeting