Download

1 / 16
160 likes | 339 Views
Introduction to Scientific Programming in MATLAB. Michael McLennan Software Architect HUBzero™ Platform for Scientific Collaboration. Accessing MATLAB. Start a workspace and type matlab. NOTE: MATLAB requires a license from Purdue, so this works only when accessing from Purdue’s campus.

E N D
Introduction to Scientific Programming in MATLAB Michael McLennanSoftware Architect HUBzero™ Platform for Scientific Collaboration
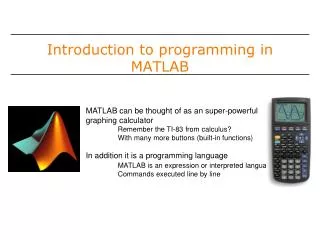
Accessing MATLAB Start a workspace and type matlab NOTE: MATLAB requires a license from Purdue, so this works only when accessing from Purdue’s campus. Try some simple commands: >> x=1 >> y=2 >> z=2*x + y >> exit
Free Clone: GNU Octave In your workspace, type octave þRuns almost all MATLAB scripts þCreates plots ýMissing fancy debugger ýMissing “simulink” toolbox
xaxis = 1:0.1:5 xaxis = linspace(1,5,41) start with this start with this increment by this end with this end with this number of points Try it with/without the semicolon. What does the semicolon do? Using Vectors Create a series of number like this: xaxis 1.0 1.1 1.2 1.3 … 4.8 4.9 5.0 Try this: >> xaxis = 1:0.1:5; >> length(xaxis) >> xaxis
xaxis = [1.0, 1.1, 3.0, 4.9, 5.0] square brackets comma-separated list of values Multiply element by element: [1.0 1.1 …] [1.0 1.1 …] More Vectors Suppose you have an irregular spacing: xaxis 1.0 1.1 3.0 4.9 5.0 Try this: >> y = 2*xaxis – 2 >> plot(xaxis,y) >> y = 3*xaxis*xaxis + 1 >> y = 3*xaxis.*xaxis + 1
-1 -1 -1 0 0 0 1 1 1 -1 0 1 -1 0 1 -1 0 1 a = aT = in MATLAB, that’s >> a’ Matrices Suppose you want to define a matrix, like this: in MATLAB, that’s >> a = [-1 -1 -1 ; 0 0 0 ; 1 1 1] Try this: >> a * a’ >> a’ * a >> a’ * a + 1 Try these built-in functions: >> zeros(3) >> ones(4) >> eye(2) >> a * a’ + eye(3)
Image Processing Try this: >> im = imread(‘/apps/matlab/7.5/toolbox/simulink/simulink/simulinkteam.jpg’); >> figure; >> imshow(im); >> a = [-1 -1 -1 ; 0 0 0 ; 1 1 1] >> im2 = imfilter(im, a, ‘conv’); >> imshow(im2); >> im2 = imfilter(im, a*a’, ‘conv’); >> imshow(im2); ‘conv’ operation Edge detection! charcoal effect Octave Users: Works in Octave 3.0 For earlier versions, download imread from http://www.cs.helsinki.fi/u/ahyvarin/kurssi/imread.m
-1 -1 -1 0 0 0 1 1 1 a = whole row column index row index Matrix Indexing in MATLAB, that’s >> a = [-1 -1 -1 ; 0 0 0 ; 1 1 1] Try this: >> a(1,1:3) >> a(1,:) Try this: >> a(2,2) = 3 >> a Try this: >> a(1,1) >> a(2,1) >> a(1,2) Pick apart image pixel by pixel… >> im(1,5) >> im(3, :) >> im(1:100, 1:100)
first component: r g b all column elements row index Back to Plotting Try this: >> rv = im(3, :, 1) >> plot(1:length(rv), rv, ‘r’) >> title(‘row 3 from image’) >> xlabel(‘pixel index’) >> ylabel(‘color value’) >> hold >> gv = im(3, :, 2) >> plot(1:length(gv), gv, ‘g’) >> legend(‘red’,’green’)
red, dotted line, circles Plotting Options Try this: >> clf >> plot(1:length(rv), rv, ‘r:o’) r Red g Green b Blue c Cyan m Magenta y Yellow k Black w White - Solid line (default) -- Dashed line : Dotted line -. Dash-dot line + Plus sign o Circle * Asterisk . Point x Cross s Square d Diamond ^ Upward-pointing triangle v Downward-pointing triangle > Right-pointing triangle < Left-pointing triangle p Five-pointed star (pentagram) h Six-pointed star (hexagram)
Functions file: edgematrix.m % returns edge detection matrix of size n % orient is 'horz' for horizontal edges, and 'vert' for vertical function m = edgematrix(n,orient) half = floor(n/2); n = 2*half + 1; for i=1:n for j=1:n if strcmp(orient,'horz') m(i,j) = j-half-1; else m(i,j) = i-half-1; end end end im2 = imfilter(im, edgematrix(5,’horz’), ‘conv’);
j -2 -2 -2 -2 -2 -1 -1 -1 -1 -1 0 0 0 0 0 1 1 1 1 1 2 2 2 2 2 i Loops file: edgematrix.m % returns edge detection matrix of size n % orient is 'horz' for horizontal edges, and 'vert' for vertical function m = edgematrix(n,orient) half = floor(n/2); n = 2*half + 1; for i=1:n for j=1:n if strcmp(orient,'horz') m(i,j) = j-half-1; else m(i,j) = i-half-1; end end end
-1 0 1 -1 0 1 -1 0 1 m = ‘horz' -1 -1 -1 0 0 0 1 1 1 anything else m = Conditionals file: edgematrix.m % returns edge detection matrix of size n % orient is 'horz' for horizontal edges, and 'vert' for vertical function m = edgematrix(n,orient) half = floor(n/2); n = 2*half + 1; for i=1:n for j=1:n if strcmp(orient,'horz') m(i,j) = j-half-1; else m(i,j) = i-half-1; end end end
-1 0 1 -1 -1 -1 0 0 0 1 1 1 1 1 1 = Programming the MATLAB Way file: edgematrix.m % returns edge detection matrix of size n % orient is 'horz' for horizontal edges, and 'vert' for vertical function m = edgematrix(n,orient) half = floor(n/2); n = 2*half + 1; for i=1:n for j=1:n if strcmp(orient,'horz') m(i,j) = j-half-1; else m(i,j) = i-half-1; end end end % returns edge detection matrix of size n % orient is 'horz' for horizontal edges, and 'vert' for vertical function m = edgematrix2(n,orient) half = floor(n/2); o = ones(2*half + 1); m = [-half:half]' * o(1,:) if strcmp(orient,'horz') m = m' end
String input Numbers and other stuff Use script name as a command to invoke the script Simple Input/Output file: hello.m % prompt for a phrase and say "hello" disp('Who are you?'); name = input('Enter your name: ','s'); age = input('Enter your age: '); mesg = sprintf('Hello, %s!', name); disp(mesg); file = input('Enter a file name: ','s'); fid = fopen(file,'w'); fprintf(fid, '%s is %d years old\n', name, age); fclose(fid); >> hello Who are you? Enter your name:Michael Enter your age:43 Hello, Michael! Enter a file name:info.txt
Other Resources Tutorials at MathWorks http://www.mathworks.com/academia/student_center/tutorials/launchpad.html MATLAB DOs and DONTs http://nanohub.org/resources/1279