Download
1 / 23
230 likes | 377 Views
Polar lows: So-called “Hurricanes” of the Arctic. Key papers: Emanuel and Rotunno: Polar lows as Arctic Hurricanes Tellus, 41A, 1-17 Businger: Arctic Hurricanes, American Scientist, Jan 91 Businger and Baik: An arctic hurricane over the Bering Sea

E N D
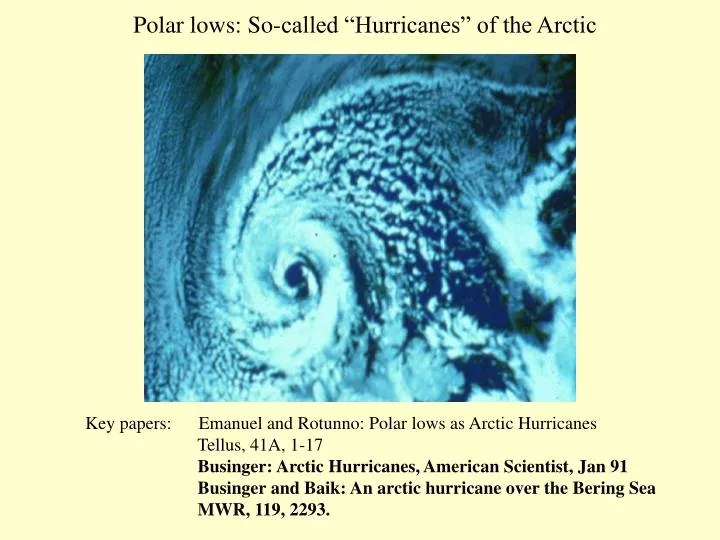
Polar lows: So-called “Hurricanes” of the Arctic Key papers: Emanuel and Rotunno: Polar lows as Arctic Hurricanes Tellus, 41A, 1-17 Businger: Arctic Hurricanes, American Scientist, Jan 91 Businger and Baik: An arctic hurricane over the Bering Sea MWR, 119, 2293.
What they look like from space… Green dot 60N 180W Red dot: St. Paul Island
Pack ice: Light blue Open Ocean: Dark Blue SST (monthly mean): Red Track: Black Boat: Soviet trauler NWS: St. Paul Island
St. Paul Island NWS data Time-Space conversion estimate of central pressure
0Z 7Mar 12Z 7Mar 0Z 8Mar SURFACE 6Z 8Mar 12Z 8Mar 18Z 8Mar
0000 UTC 7 March Surface 850 mb 700 mb 500 mb Satellite 2230 UTC 6 Mar
1200 UTC 7 March Surface 700 mb 0000 UTC 8 March Surface 700 mb Satellite 2145 UTC 7 Mar
1200 UTC 8 March Surface 850 mb 700 mb 500 mb Satellite 2100 UTC 8 Mar
1200 UTC 7 March Surface 700 mb Landfall
Quasi-Geostrophic Forcing (Q vector formulation)
Quasi-Geostrophic Forcing (Q vector formulation)
Apparent source of energy… Sensible (primary) and latent (secondary) heat flux from “warm” (in a relative sense) ocean surface.
Sensible Heat Fluxes (W/m2) 1800 UTC March 8, 2005 Maximum in region of strong winds in arctic air Minimum in core where air is warm and winds light
Core of Polar Low St. Paul’s Island at 12Z 7 March St. Paul’s Island at 12Z 8 March 21Z 7 March 21Z 8 March
“Potential Thickness” vs Environmental Thickness (m) Upper limit to which sea surface can modify atmosphere Potential thickness: Thickness (1000-500 mb) that would result if the environmental lapse rate were modified to lie along a moist adiabat representing saturation at 1000 mb at the sea surface temperature.
Model simulation using axisymmetric tropical cyclone model 15 vertical layers, 20 km resolution, 1500 km domain
Time evolution of modeled sensible, latent and total heat fluxes Sensible heat flux exceeds latent heat flux throughout simulation
Convective heating profiles: vertical redistribution of heat By the convective scheme used in the model ratio of unresolved (convective parameterization) vs. resolved Latent heating (precipitation rate).
Temp deviation from model boundary Relative Humidity
Sensitivity to initial vortex intensity used in the model Conclusion: Polar low will not form unless an initial disturbance Exists, normally associated with baroclinic instability
Sensitivity to sea surface temperature used in the model Conclusion: Final intensity of storm a strong function of SST