Download
1 / 15
170 likes | 681 Views
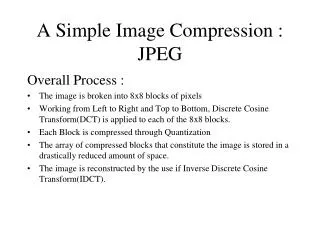
JPEG 2000 Image Analysis. Darius Fennell University of Rochester. Experiment Objective. Using JPEG 2000 calculate and analyze the following: Distortion vs. Rate Distortion vs. Quantization Time vs. Quantization Time vs. Resolution. Experiment Materials. Dell Computer 2.79 GHz Processing

E N D
JPEG 2000 Image Analysis Darius Fennell University of Rochester
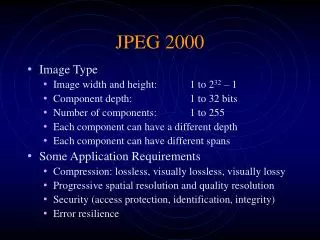
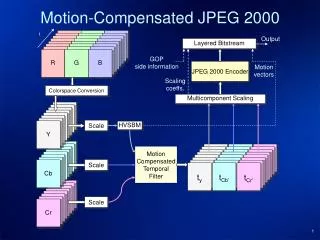
Experiment Objective • Using JPEG 2000 calculate and analyze the following: • Distortion vs. Rate • Distortion vs. Quantization • Time vs. Quantization • Time vs. Resolution
Experiment Materials • Dell Computer • 2.79 GHz Processing • 2.00 GB of RAM • Matlab 7.0.1 R14 • Kakadu JPEG 2000 software • 5 Standard images
Standard Imagery • Originally 3 bands @ 512x512 • Reduced to single band 128x128
Expectation • Distortion vs. Rate • As rate increases distortion decreases • Distortion vs. Quantization • As step size decreases distortion decreases • Time vs. Quantization • As quantization increases time decreases • Time vs. Spatial Resolution • As Spatial Resolution increases time increases
Distortion vs. Rate • Imagery compressed at multiple rates: • 7.0,4.0,2.0,1.0,0.5, and 0.25 • Average Bit Rate per pixel • Imagery decompressed to each rate and compared to the original. • MSE=var(original-decompressed)
Quantization • Imagery compressed using varying step sizes:2^-7 to 2^7 • MSE calculated • Processing time determined by Matlab’s tic/toc command
Time vs. Spatial Resolution • Images Sizes: • 512x512 • 256x256 • 128x128 • 64x64 • Processing time determined by Matlab’s tic/toc command
Conclusion • Rate & quantization have a drastic effect on the error. • Step size does not significantly effect compression time for quantization. • Increased spatial resolution increases compression time yet other factors are involved that affect the over processing chain.
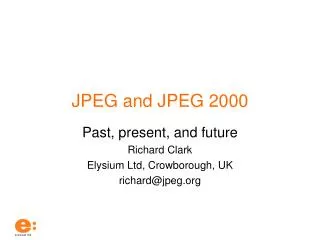
References • http://www.kakadusoftware.com • http://www.gvsu.edu/math/wavelets/student_work/EF/index.html