Download
1 / 28
280 likes | 425 Views
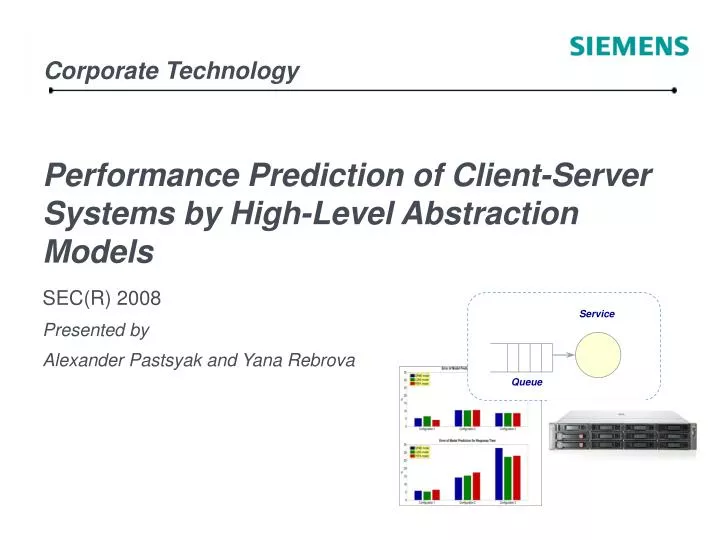
Performance Prediction of Client-Server Systems by High-Level Abstraction Models. SEC(R) 2008 Presented by Alexander Pastsyak and Yana Rebrova. Service. Queue. Outline. Motivation Formalisms to describe system performance Layered Queuing Networks (LQN)

E N D
Performance Prediction of Client-Server Systems by High-Level Abstraction Models SEC(R) 2008 Presented by Alexander Pastsyak and Yana Rebrova Service Queue
Outline • Motivation • Formalisms to describe system performance • Layered Queuing Networks (LQN) • Performance Evaluation Process Algebra (PEPA) • Queuing Petri Nets (QPN) • Architecture of the Test System • Experiments • Results • Conclusion
Motivation Real systems composed from many components Software Performance models Service out Web server in Queue out in Application server in Two place buffer in out Buf2 Database
What do we want to do? How to map different system architecture entities to the model elements (build the models)? • What is the method to calibrate the models? What kind of predictions can be obtained from the models for response time and throughput characteristics?
Used formalisms and tools Formalisms Tools A V A I L A B I L I T Y A C T U A L I T Y Layered Queuing Networks (LQN) LQNSolver PEPA Workbench Stochastic Process Algebras (SPA) Stochastic Petri Nets (SPN) QPN Modeling Environment (QPME)
Formalisms:Layered Queuing Networks Queuing Network Request processing Request Queue Client Server Layered Queuing Network Request processing Request processing Request1 Request2 Queue Queue Client Server1 Server2
LQN- Model Building Blocks Processors are used by activities within a performance model to consume time. Processors Tasks are used in layered queuing networks to represent software resources Tasks Entries service requests and are used to differentiate the service provided by a task. Entries Activities are the lowest-level of specification in the performance model. Activities Precedence is used to connect activities within a task to form an activity graph Requests Precedence Service requests from one task to another
LQN – Model Example users [0] users{4} Z=3 workstation [5] net_2 [0.001] net_1 [0.001] workstations {4} network {inf} server_2 [22] server_1 [10] server_2 server_1 printer [100] disk_2 [0.01] disk_1 [0.01] disk_2 printer disk_2 disk_1 server
Formalisms:Layered Queuing Networks Advantages Disadvantages LQN is the most powerful formalism to describe client-server systems Models are not suitable for formal verification Packages for direct solution and simulation are available Lack of good model editor with graphical user interface
Formalisms:Queuing Petri Nets Generalized Colored Petri Net Places Tokens T_Enter T_Service Timed transition Immediate transition Queuing Petri Net queue depository
QPN- Model Building Blocks Tokens Tokens are the “value” or “state” of a place Tokens fired onto such a place are immediately available for the corresponding output transitions Places Tokens are inserted into the queue. After completion of its service, a token is immediately moved to the depository, where it becomes available for output transitions of the place. Ordinary places Queuing places Transitions Transitions change the number of tokens in places An enabled timed transition fires after a certain delay. Timed Transitions Immediate Transitions Immediate transition fires without any delay in zero time.
QPN – Model Example Ordinary place Queuing place Immediate transition DB connections pool Clients Web Server 1 DB Server
Formalisms:Queuing Petri Nets Advantages Disadvantages Analysis suffers the state space explosion problem and this imposes a limit on the size of the models that are analyzable Easy to model distributed client-server systems Allows to handle several request types in the same model Difficult to model synchronous requests QPME tool offers convenient graphical user interface for models editing Models are not suitable for formal verification Only simulation technique is currently available in QPME tool QPME tool is under development and some problems occur in the analysis package
Formalisms:Performance Evaluation Process Algebra Stochastic Process Algebra Process P1 Process P2 a,r Performance Evaluation Process Algebra • Duration is exponentially distributed • Activity is called shared if several components synchronize over it • The rate of the shared activity is defined by cooperation with another component.
PEPA – Model Building Blocks Components Components carry out activities Each activity is characterized by an action type α and duration r which is exponentially distributed. This is written as a pair (α, r). Activity Combinators allow building expressions to define behavior of components via activities. Combinators
PEPA – Model Example Cooperation<r1,r2> Cooperation<a_db> Component Component Component Component Client Web Server Database a3,r3 a1,r1 a,r a2,r2 a4,r4 a5,r5 Internal structure of component
Formalisms:Performance Evaluation Process Algebra Advantages Disadvantages Analysis suffers the state space explosion problem and this imposes a limit on the size of the models that are analyzable Easy to model several synchronous components Packages for direct solution and simulation are available Some components (like Load Balancer) are not easy to model. Models are suitable for formal verification It’s not easy to make graphical representation of the model Powerful tools for models analysis PEPA Workbench supports only text models
Modeling of the test system - LQN users [40] Request processing [256] Clients Load Balancer WebServer1 WebServer2 Workstationwith Users Load Balancer Database Request processing [8] Request processing [inf] Request processing [8] Web Server 1 DB Server 2 Web Server 2
Modeling of the test system - QPN =? Clients Thread pool Load Balancer WebServer1 WebServer2 Database
Modeling of the test system - PEPA =? Clients Load Balancer Component WebServer1 WebServer2 Database Component Component Cooperation<L> Cooperation<L> Component
Experiments Throughput and Response Time are measured for three different configurations with virtual users changing from 1 to 40 Configuration 1 - LB • Load Balancer • WebServer1, WebServer2 • Database Configuration 2 – PC1 • WebServer1 • Database Configuration 3 – PC2 • WebServer2 • Database
Models Calibration Service rates for Web Server1 ,Web Server2, DBserver = ? Need to define parameters in the models WebServer 2 (2.2 Ghz Core2Duo) 1 UserRT = 0.6secUsageCPU = 35% Experiment with one webserver and special workload – 1 user. WebServer 2Tprocessor = RT*UsageCPU*Ncores==0.6*0.35*2 = 0.42 sec Get the time spent by CPU for request processing Identify the same time for another webserver by normalization to CPU frequency WebServer 1 (3.5Ghz Celeron)Tprocessor = 0.42/3.5*2.2 = 0.264 sec RateWS1 = 0.42-1=2.38 sec-1RateWS2 = 0.26-1=3.78 sec-1RateDB = (0.6-0.42)-1=5.5 sec-1
Conclusions All of the applied techniques are able to predict system behavior without detailed knowledge about the internal system structure Difference between model predictions and experimental results lies in the acceptable area:for throughput it’s less than 10%,for response time – less than 30% Such results make possible to use model predictions during early performance analysis of infrastructure for distributed business applications The investigation of errors caused by hidden structure of system components and methods to estimate them is the subject for further work
Q&A • Thank you for attention!