Download
1 / 33
380 likes | 646 Views
OVERVIEW OF THE CITY OF JOHANNESBURG STRATEGIC TRANSPORTATION MODELLING FRAMEWORK. City of Johannesburg. Department of Development Planning, Transportation and Environment Transportation Planning and Management 08 September 2004 Presented by: Mathetha Mokonyama

E N D
OVERVIEW OF THE CITY OF JOHANNESBURG STRATEGIC TRANSPORTATION MODELLING FRAMEWORK City of Johannesburg Department of Development Planning, Transportation and Environment Transportation Planning and Management 08 September 2004 Presented by: Mathetha Mokonyama Venue: South African Emme/2 Users Conference, Pretoria
1. INTRODUCTION 2. OVERVIEW OF THE CITY OF JOHANNESBURG 3. TRANSPORTATION PLANNING IN THE CITY OF JOHANNESBURG 4. STRUCTURE OF THE CITY’S STRATEGIC TRANSPORTATION MODEL AND SOME OUTPUTS 5. ADDITIONAL FUTURE APPLICATIONS OF TRANSPORTATION MODELLING 6. SOME TRANSPORTATION MODELLING CHALLENGES 7. RECOMMENDATIONS 8. CONCLUSIONS CONTENTS
Provide and overview of the City of Johannesburg Transportation Modelling Framework Present Current and Future Applications of Emme/2 in the City of Johannesburg Share some of the Transportation Modelling challenges faced Illustrate the role that could be played by INRO in growing the profession in Southern Africa 1.1 OBJECTIVES OF THE PRESENTATION
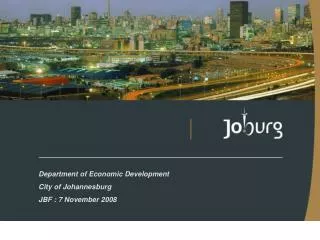
2.1 GEOGRAPHIC LOCATION CITY OF JOHANNESBURG GAUTENG PROVINCE SOUTH AFRICA
Voted the most popular City in South Africa in 2003 by South Africans Population of 3 225 815 in 2001, growing annually at at average of 4.1% Total of 1 006 744 households in 2001, growing annually at an average of 6.5% Average Population density of 19.6 persons/ha and Average household density of 6.1 hh/ha, both in 2001 Car ownership at an average 170cars/1000 population in 2003 (all registered light passenger cars) 2.2 SOCIO–ECONOMIC PROFILE
Economy is increasingly becoming Services Industry led, and to be strengthened in that direction Contributes about 16% to South Africa’s GDP Has only about 7% of South Africa’s population In 2001 48% of economically active persons formally employed, 14% informally employed and 38% unemployed The City historically an Apartheid City, still reflected in the distinct spatial distribution of class and race 2.3 SOCIO-ECONOMIC PROFILE CONTINUED
Transportation Planning part of a bigger department:Development Planning,TransportationandEnvironment Mandate – To Deliver: “A safe and efficient transportation system, with a public transport focus, that will support a world class City; connecting businesses, people and places in a sustainable and cost effective manner and through this, improve the standard of living and quality of life of all the City’s inhabitants and the overall competitiveness and growth of the City’s economy” 3.1 TRANSPORTATION PLANNING MANDATE
Only recently that Transportation Modelling is being prioritised, since early 1990’s The role of Transportation Modelling within Transportation Planning in the City: “ to provide analytical assessment of development planning interventions and their associated financial implications, as far as they relate to travel demand management” Communication with relevant stakeholders, in respect of modelling, identified as of paramount importance 3.2 THE ROLE OF TRANSPORTATION MODELLING IN THE CITY
4. STRUCTURE OF THE CITY’S STRATEGIC TRANSPORTATION MODEL AND SOME OUTPUTS
Specialised Surveys Sub-Area Models (Extensive period, access, relationship with the City, etc) Strategic Transportation Model** Land Use Model (Linkage with SDF&RSDF) Key Performance Indicators Interventions and Cost Estimates 4.1 THE CITY’S TRAVEL DEMAND MANAGEMENT MODEL
Software combination: Emme/2, Arcview, Microsoft Access, Microsoft Excel, StatGraphics Built with very limited budget Emme/2 coded with Private routes (car) and Public Transport routes( taxi, bus, rail) A total of 667 traffic zones (Including 37 external zones) 4.2 STRATEGIC TRANSPORTATION MODEL
Sub-Models Trip Generation: Microsoft Access, Microsoft Excel Car Ownership: Spatially Based, Microsoft Excel, Arcview Modal Split: Simplified Logit (Public transport mode sensitive) Trip Distribution: Emme/2 matrix balancing (Gravity) Land Use: Microsoft Access, Microsoft Excel, Arcview Emme/2 Matrix manipulations Assignment model (private and public) Simple macros Model validation using link counts revealed good correlation No matrix adjusting using counts 4.3 INTERACTION BETWEEN SUBMODELS AND SOFTWARE APPLICATIONS
Trip Generation with Primary Modal Split by trip purpose HH Income, HH Learners, HH Car Ownership, HH Employed Persons, Job Opportunities, Zonal Income Category 4.4 TRAVEL DEMAND STRUCTURE Non-Motorised Motorised Private Transport Public Transport Mode Captive (Rail, Bus, Taxi) Mode Sensitive (Rail, Bus, Taxi)
4.5 TRANSPORTATION SUPPLY STRUCTURE Modelled Network Modes (Car, Bus, Taxi, Rail, Walk) Private: Vol-Delay Functions Typical BPR functions e.g. fd11= (length*60/120*(1+0.15* ((volau+volad)/(lanes*1820*0.75))^6)) Public Transport Routes (dwt, ttfl, mod, operator, layover) Public Transport Functions (Operator specific, Value of time, Fare levels, timau) e.g. ft1 = timau + length*0.2008 Under review
4.6 MARKETS ESTIMATION AND INHERENT COMPLEXITIES Public Transport Market 759 733 Private = 870 450 (53%) Public = 759 733 (47%) Taxi: 79% Bus: 8% Rail: 13% Mode Captive 87% Mode Sensitive 13% Operator Captive Operator Sensitive Rel. Low Value of Time Rel. High Value of time Operator Captive Operator Sensitive
4.7 ENVISAGED ULTIMATE TRAVEL DEMAND MANAGEMENT MODEL OF THE CITY Potential Public Transport Travel Demand • Mode Captive • Objective: Service Capacity • ft = fn(length) Mode Sensitive From Existing Private Demand From existing Mode sensitive ft = fn(value of time, fare, length) Modal Split Targets e.g. 100:0, 80:20, 50:50, 30:70 ft = fn (value of time, fare, length, quality) Estimate service costs
N 4.10 CoJ TRAFFIC ZONES • Total of 667 zones • 567 Joburg zones • Used Regional Indices
4.11 MORNING PEAK HOUR V/C RATIOS >1.5 >1.0 >0.8 >0.4
5. ADDITIONAL FUTURE APPLICATIONS OF TRANSPORTATION MODELLING
Some input into Environmental Management (Air Quality Legislation) Municipal Capital Investment Framework Linkage with statutory Spatial Development Framework Preparation of subarea models (accessibility, extensive period, relationship with the whole City) 5.1 INTERDEPARTMENTAL CROSS-CUTTING INITIATIVES
Very Limited Allocated Budget Non-validated volume-delay functions Non validated public transport functions Information Flow breakdown, from discipline to discipline Illegal taxi operators – route coding Very Large Household Income gaps Racially and Class based transport system 6.1 CHALLENGES FACING TRANSPORTATION MODELLING IN THE CITY
Entry very expensive Handful of Transportation Engineers Very limited dedicated transportation research Linkage with academia very poor Virtually no new entrants in to the discipline Very few firms with know-how and facilities 6.2 BARRIERS FACING THE GROWTH OF THE PROFFESSION
7.1 THE RECOMMNDED ROLE OF SOFTWARE DEVELOPERS AND AGENTS IN GROWING THE PROFESSION • INRO to be commended for reliable support • Areas of improvement for INRO • Academic Support/Academic licenses. • Assist in research into various transport operating conditions. • Pricing structure to be sensitive to the developmental needs. • Participation in South African conferences e.g. SATC. • Ownership of software license needs to be guaranteed over a given period, to allow more licenses to be bought.
8.1 CONCLUSION • The City of Johannesburg has made a choice to continue using Emme/2 for Strategic Transportation Modelling purposes • The City is increasingly embracing input from transportation modelling • The City will welcome any ideas to strengthen the transportation modelling discipline, in line with its transportation planning mandate