Download
1 / 30
300 likes | 388 Views
Type 2 diabetes and cardiovascular disease Christopher D. Byrne FRCPath FRCP PhD Professor of Endocrinology & Metabolism Director of Wellcome Trust Clinical Research Facility Southampton University Hospitals Trust.

E N D
Type 2 diabetes and cardiovascular disease Christopher D. Byrne FRCPath FRCP PhD Professor of Endocrinology & Metabolism Director of Wellcome Trust Clinical Research Facility Southampton University Hospitals Trust
Impact of diabetes on the average annual age-adjusted incidence/1,000 cardiovascular events in men and women aged 45-74 years from the Framingham study
STABLE ATHEROSCLEROTIC PLAQUE intimal smooth muscle cells (repair phenotype) fibrous cap (smooth muscle cells & matrix) endothelial cells lipid core adventitia medial smooth muscle cells (contractile phenotype)
UNSTABLE CORONARY ARTERY DISEASE lipid core lipid core adventitia
PATHOGENESIS OF ATHEROSCLEROSIS Accumulation of modified lipid Endothelial cell activation Inflammatory cell migration Inflammatory cell activation Smooth muscle cell recruitment Proliferation and matrix synthesis Fibrous cap formation Plaque rupture Platelet aggregation Thrombosis Matrix degradation Smooth muscle cell apoptosis Growth factors Growth factors
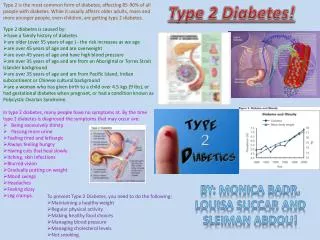
What is Type 2 diabetes? A progressive metabolic disorder characterised by: Type 2 diabetes -cell dysfunction Insulin resistance Adapted from: Beck-Nielson H et al. JClin Invest 1994;94:1714–1721 and Saltiel AR, Olefsky JM. Diabetes 1996;45:1661–1669
Insulin resistance and insulinhypersecretion precede type 2 diabetes Insulin Insulin Macrovascularsensitivity secretion disease 30% 50% 50% 50% 70–100% 40% 70% 150% 10% 100% 100% Type 2 diabetes IGT Impaired glucose metabolism Normal glucose metabolism Adapted from: Beck-Nielsen H, Groop LC. J Clin Invest 1994;94:1714–1721
Clinical indicators ofthe Insulin Resistance Syndrome • + Insulin resistance • + Type 2 diabetes or IGT • + Dyslipidaemia ( TG, LDLc, HDLc) • + Central obesity • + Hypertension • + Hyperinsulinaemia (initially) • + Atherosclerosis DeFronzo RA, Ferrannini E. Diabetes Care 1991;14(3):173–194
Glucose uptake in insulin-resistant subjects: impaired in patients with type 2 diabetes 3,000 Lean 2,500 Obese 2,000 1,500 Whole-body glucose uptake (µmol/m2/min) Type 2 diabetes 1,000 500 0 10 100 1,000 10,000 100,000 Serum insulin (pmol/L) Adapted from Baron AD. Am J Physiol 1994;267:E187–E202
Muscle (PKC Insulin resistance and -cell dysfunction produce hyperglycaemia in type 2 diabetes Pancreatic -cell Insulin resistance Increased lipolysis Elevated plasma NEFA Liver + - Elevated TNF Islet -cell degranulationReduced insulin content Adipose tissue Increased glucose output Low plasma insulin Decreased glucose transport& activity (expression) of GLUT-4 HYPERGLYCAEMIA Modified from: Turner N, Clapham JC. Prog Drug Res 1998;51:34–94
P<0.001 Relative risk of death Body mass index (kg/m2) Relative risk of death due to cardiovascular disease according to BMI among non-smoking women aged 30 to 55 years Manson, J.E. et al. New England Journal of Medicine 1995; 333: 677-85.
Age-adjusted relative risk Body mass index (kg/m2) Relative risk of type 2 diabetes according to BMI in US women aged 30 to 55 years Colditz GA et al. Annals of Internal Medicine 1995; 122: 481-86.
Why does obesity cause type 2 diabetes? • high levels of free fatty acids found in obese or overweight patients, interfere with glucose metabolism
Mechanisms of insulin resistance linking fatty acid and glucose metabolism Increased adipocyte lipolysis (central obesity) hepatic gluconeogenesis glycogen content glycogen synthase FFAs acetyl CoA (cellular) pyruvate dehydrogenase NADH/NAD citrate phosphofructokinase plasma glucose glucose transport hexokinase glucose 6-P
Differences between visceral and subcutaneous fat Visceral fatSubcutaneous fat 6-20% of total body fat 80% of total body fat Greater number of smaller cells Smaller number of large cells with richer blood supply with poorer blood supply Intra-abdominal with direct Extra-abdominal drainage to portal vein Greater catecholamine-induced Reduced catecholamine-induced lipolysis lipolysis Reduced insulin inhibition of Increased insulin inhibition of lipolysis lipolysis
How can the impact of diabetes and metabolic syndrome to cause vascular disease be reduced?
How can insulin resistance be reduced? Lifestyle Weight reduction - optimum BMI in Caucasians? Increasing levels of energy expenditure Medication Metformin & Glitazones
Reduction in risk of various clinical endpoints with metformin (n=342) compared with a conventional policy in overweight patients (BMI=31) with type 2 diabetes Clinical endpoint Risk reduction p value Any diabetes-related endpoint 32% 0.002 Diabetes-related deaths 42% 0.017 All-cause mortality 36% 0.011 Myocardial infarction 39% 0.010 Data taken from UK Prospective Diabetes Study (UKPDS) group. Lancet 1998; 352: 854-65.
How does activation of PPAR enhance insulin action and normalise blood glucose? Reduced hepatic glucose output Adipocyte Liver Reversal of TNF-induced insulin resistance GLUT-4 Reduced lipolysis and free fatty acid availability Increased insulin sensitivity and capacity for glucose disposal/lipid storage Euglycaemia PPAR Glitazone and insulin Skeletal muscle TG & PKC PPAR Pre-adipocyte Increased glucose disposal Increased differentiation
Treatment with glitazones Diagnosis Diet and Exercise Normal weight Overweight HbA1c > 7% Sulphonylurea Metformin HbA1c > 7% HbA1c > 7% Can’t use Metformin Obese Add Glitazone
Combination therapy? PPAR gamma and PPAR alpha agonists
Insulin resistance Adverse experiences Complications Drug interactions Future challenges for type 2 diabetes management Glucose control -cell function