Download
1 / 38
380 likes | 483 Views
RGGI Amendments: Implications for New England and the World. April 26, 2013 Energy Roundtable Ken Kimmell Commissioner, Massachusetts Department of Environmental Protection Secretary, RGGI, Inc. Board of Directors. Driving Regional Clean Energy Investment.

E N D
RGGI Amendments:Implications for New England and the World April 26, 2013 Energy Roundtable Ken Kimmell Commissioner, Massachusetts Department of Environmental Protection Secretary, RGGI, Inc. Board of Directors
Driving Regional Clean Energy Investment • The RGGI States have already invested more than $617 million of auction proceeds in a broad range of clean energy, direct bill assistance, GHG abatement, and climate change adaptation programs • Benefits business and families by reducing energy bills, creating jobs, reducing harmful pollutants • Reduced overall demand for electricity reduces market price of electricity for all consumers (Price Suppression)
Driving Mass Clean Energy Investment • Massachusetts earned the #1 energy efficiency ranking in the U.S. in the American Council for an Energy Efficient Economy’s 2011 Scorecard.
Analysis Group Report ConclusionRGGI Delivers Results: Savings, Value, Jobs $1.6 BILLION In net economic benefit to the region1 $1.3 BILLION In energy bill savings across the region1 16 THOUSAND Job-years created1 $765 MILLION Kept in region (avoided fuel costs)1 1Source: Analysis Group (2011)
Factors Driving GHG Reduction in the RGGI Region • Key reasons for power sector emissions reductions from 2005 to 2009 were: • Switch to natural gas • 31% due to changes in relative fuel prices due to lower natural gas prices • Increased energy efficiency • 12% was due to Energy Efficiency • More renewable energy • 6.2 % is related to increase in Hydro/Wind Capacity • Weather and the economy
Auction Results * For First Control Period Allocation Year Allowances
Auction Results * For First Control Period Allocation Year Allowances
Auction Results * Second Control Period Allocation Year Allowances
Modeling Timeline & Cap Options Considered • Reference Case (Projections for RGGI without changes) Sept. 2011 • Sensitivities (Variations of key variables e.g. fuel prices and load) Sept. 2011 • Policy Scenarios (120 Cap, 115 Cap, 106 Cap) March 2012 • Revised Reference Case Aug. 2012 • Revised Sensitivities Aug. 2012 • Policy Scenarios (106 Cap, 97 Cap, 91 Cap) Nov. 2012 • Policy Scenarios (97 & 91 Cap Alt Bank) Jan. 2013 • 91 Cap Feb. 2013
RGGI Program Review-Updated Model Rule • Summary of Program Changes • Size and Structure of the Cap • Interim Adjustments for Banked Allowances • Cost Containment Reserve (CCR) • Undistributed and Unsold Allowances • Flexibility Mechanisms • U.S. Forests Offset Protocol • Offsets • Interim Control Periods • Reserve Price • Miscellaneous
Interim Adjustments for Banked Allowances(Model Rule XX-5.3 – Illustrative Example) • Assume that the first control period private of allowances (2009-2011) is 49 million and second control period private bank of allowances (2012-2013) is 60 million. • In the example below: • A reduction to the budget is made for 100% of the first control period private bank of allowances over a 7 year period (2014-2020). • A reduction to the budget is made for 100% of the second control period private bank of allowances over a 6 year period (2015-2020).
Cost Containment Reserve (CCR) (Model Rule XX-1.2, XX-5.3, XX-9) • The CCR allowances will be sold at any auction if demand for allowances at prices above the CCR trigger price exceeds the supply of non-CCR allowances, until all CCR allowances available for the year are sold. • CCR allowances will only be sold at or above the CCR trigger prices of: • $4 in 2014, • $6 in 2015, • $8 in 2016, • $10 in 2017, and adjusted 2.5% in each calendar year thereafter. • A fixed annual quantity of 5 M CCR allowances in 2014 and a fixed annual quantity of 10 M CCR allowances thereafter, with annual replenishment as needed, up to the fixed quantity to ensure availability of allowances each year. The updated Model Rule contains language for the adoption of a CCR as a cost containment flexibility mechanism, with the following design elements:
Resulting Emission Reductions • Analyses indicate that these program changes will generate approximately 80 - 90 million tons of cumulative CO2 reductions by 2020. This quantity of reduction is approximately equal to: • The annual GHG emissions from 15 million passenger vehicles, or • Thirty times the annual GHG emissions from MA’s largest power plant, or • Four to five times the annual GHG emissions from all the power plants in the Commonwealth, • The total 1990 Massachusetts Baseline GHG Inventory.
Electric Sector Reductions • The MA 2011 electric sector emissions represents a reduction of approximately 35% from the MA 1990 baseline year electric sector emissions. • The 2020 MA RGGI Cap represents a reduction of approximately 50% from the MA 1990 baseline year electric sector emissions.
RGGI Program Review-Updated Model Rule • Emissions Leakage: “In order to identify a workable policy on emissions associated with imported electricity, the states commit, over the course of the next year, to engage in a collaborative effort supported by RGGI state staff and informed by discussions with their respective ISOs, to identify and evaluate potential imports tracking tools, conduct further modeling to ascertain energy and price implications of any potential policy on emissions associated with imported electricity, and pursue additional legal research necessary, leading to a workable, practicable, and legal mechanism to address emissions associated with imported electricity.”
RGGI Recommendations from Program Review:Implications for New England and the Nation April 26, 2013 Energy Roundtable David Littell Commissioner, Maine Public Utilities Commission Vice Chair, RGGI, Inc. Board of Directors
RGGI’s Efficient Market-Based System • At the end of the first control period, compliance entities and their affiliates held 98 percent of all allowances in circulation • After four years no evidence of anti-competitive conduct • 19 quarterly auctions held since September 2008 • 487,381,050 total allowances sold • $1.2 billion in total proceeds • First control period allowance auction clearing prices ranged from $1.86 to $3.51. • Second control period allowance auction clearing prices have ranged from $1.93 to $2.80.
RGGI Region: Power Sector CO2 Emissions Current and Projected
RGGI Model Rule Scenario Analysis Assumptions Most Recent IPM Modeling Reflects Model Rule Program Recommendations • The regional cap beginning at 91 million tons in 2014 • The Interim Adjustment for Banked Allowances • The revised CCR triggers and the modified CCR size for 2014 2 scenarios related to the potential use of banked allowances: To examine different assumptions for how market participants might use banked allowances for compliance purposes, the states used alternate banking usage scenarios: 1) 91 Cap Bank MR The IPM model predicates rationale behavior based on perfect foresight (i.e., knows all future market outcomes, including allowance prices and how to maximize use of the bank with perfect certainty ). 2) 91 Cap Alt Bank MR Assumes that market participants make decisions related to use of banked allowances for compliance on a shorter time horizon (i.e., due to uncertainty, realize gains sooner on private bank, thus holders more heavily on banked allowances in the short-term than hold).
RGGI Model Rule Scenario Results Sources of Emission Reductions 91 Cap_Bank_MR 86 M Tons Use of Bank = 115 M Tons CCR = 17.6 M Tons
RGGI Model Rule Scenario Results Sources of Emission Reductions 91 Cap_AltBank_MR 91 M Tons Use of Bank = 115 M Tons CCR = 10 M Tons Offsets = 3 M Tons
RGGI Model Rule Scenario Results Allowance Prices 91_Cap_MR Cases 91 Cap AltBank CCR Allowances 10 M in 2020 91 Cap Bank CCR Allowances 2014: 5 M 2015: 10 M 2020: 2.6 M
RGGI Model Rule Scenario Results91_Cap_Bank_MR & 91_Cap_Alt Bank_MR – Results Summary
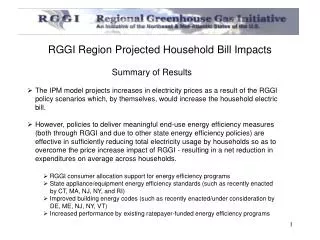
Regional Bill Impact Bill Impact Analysis conducted by the Analysis Group
What are the Macroeconomic Benefits? REMI Analysis • RGGI States wanted to look at new benefits • Needed to look at macroeconomic benefits in addition to the benefits from the current RGGI program • This draft analysis provides information for the overall program review process • Analysis projects the macroeconomic impacts of the incremental changes between the current RGGI program (REMI Reference Case) and potential changes to the RGGI program (91 Cap Bank IPM Potential Scenario) • Analysis doesn’t include benefits of investing RGGI proceeds generated after 2020
REMI Inputs from IPM model runs:States’ Investments of RGGI Allowance Proceeds • Cumulative projected proceeds for the IPM Reference case (prior to any changes to the existing RGGI program) are $1,549.97M (2010$). • Cumulative projected proceeds for the 91 Cap Bank Potential Scenario are $3,783.49M (2010$), representing an additional $2,233.51M (2010$) in proceeds compared to the Reference Case
Climate Change is CausingSea Levels Rising Faster than IPCC Modelled • Satellite data show sea levels rose by 3.2 millimeters (0.1 inch) a year from 1993 to 2011 — 60 percent faster than the 2 mm annual rise projected by the UNFCC for that period. • Best estimate for sea level rise is between 50 cm and a meter this century • “For New York City it has been shown that one metre of sea level rise could raise the frequency of severe flooding from once per century to once every three years,” says Stefan Rahmstorf of the Potsdam Institute for Climate Impact Research.2 Comparing climate projections to observations up to 20111 Sources: 1) Environmental Research Letters, Comparing climate projections to observations up to 2011 , 2012, with additional information in the graph clarifying the projections by Kevin Drum2) Science Daily, Significant Sea-Level Rise in a Two-Degree Warmer World, 2012
National Climate Assessment Draft • Sea Level Rise: Past, Present and Future
1 Meter Rise in Sea Level:Eastern U.S. Coastal Flooding Spatial extent of 1- and 6-m potential future sea-level rise along the East and Gulf coasts of the United States and for selected major coastal municipalities. Source: PNAS, Projections of future sea level becoming more dire, 2009
Climate Change to IncreaseFrequency of Extreme Storm Surges • “The most extreme events are especially sensitive to temperature changes, and we estimate a doubling of Katrina magnitude events associated with the warming over the 20th century.” • “2–7 increase in the number of Katrina magnitude surges for each degree of global warming. This increase does not include the additional increasing surge threat from sea level rise.” • “We have probably crossed the threshold where Katrina magnitude hurricane surges are more likely caused by global warming than not.” Source: PNAS, Projected Atlantic hurricane surge threat from rising temperatures, 2013
Federal Programs – Clean Air Act 111(D) • The RGGI states generally support national efforts to reduce power-sector emissions pollution • The RGGI states generally believe the states and generation sector should receive full credit for RGGI reductions when and if a federal program to address CO2 emissions from the power sector moves forward • State CO2 Budget Trading Programs, such as RGGI, should provide an recognized pathway for state compliance • States and their generation fleets operating with CO2 Budget Trading Programs should receive full credit for reductions • States operating with CO2 Budget Trading Programs should receive full credit for reductions from use of allowance proceeds
U.S. Forests Offset Protocol (Model Rule XX-10.2 and XX-10.5) • The states have developed a RGGI U.S. Forests Offset Protocol, with the intent that the Updated Model Rule incorporates the protocol by reference. • For those states that adopt this new protocol, it includes: Forestry Management, Avoided Conversion, and Reforestation. • The new RGGI U.S. Forests Offset Protocol is based on the California Air Resources Board (CARB) U.S. Forest Offset Protocol.1 • States that adopt this new protocol may accept projects that have been registered with the Climate Action Reserve. • The RGGI Protocol uses a discounting approach to address reversals and ensure performance. • The states will require compliance with general offset requirements contained in the Model Rule, including additionality, verification, and the application process, as appropriate. 1 See CARB Compliance Offset Protocol for U.S. Forest Projects: http://www.arb.ca.gov/cc/capandtrade/protocols/usforestprojects.htm