Download
1 / 14
170 likes | 570 Views
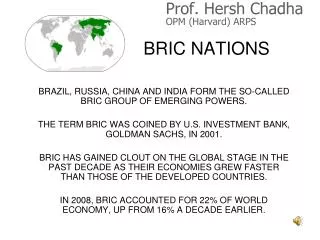
HISTORY OF GLOBALIZATION---BRIC. AGENDA. History of globalization Why BRIC Analysis on Historical timeline, Economic growth, Trade India Russia China Brazil Future of BRIC Interdependencies Conclusion. Why BRIC. Explanation. Over twenty-five percent of the

E N D
AGENDA • History of globalization • Why BRIC • Analysis on Historical timeline, Economic growth, Trade • India • Russia • China • Brazil • Future of BRIC • Interdependencies • Conclusion
Why BRIC Explanation • Over twenty-five percent of the • world's land coverage • Forty percent of the world's • population • Hold a combined GDPof 15.435 • trillion dollars. • Are among the biggest and fastest • growing Emerging Markets. • Fast growing economies with the biggest source of labour. • In 2005 the emerging economies overcome developed economies by their share in the World GDP calculated at purchasing power parity.
Historical Timeline Brazil Russia
Historical Timeline India China
Recent Income Change in BRIC • Brazil: • 1994 Brazil came out of recession • Growth at 3% annually • Challenges to more rapid income growth in` Brazil. • Russia: • After the economic collapse of 1998, Russia experienced strong growth • A devalued ruble and high world oil prices helped boost Russian economic • growth • India: • Increasing service exports and foreign investment - India’sengines of • economic growth • An increasing focus on education and literacy boosted India’s productive • capacity. • China: • Comprehensive reforms in the financial and corporate sectors aided • China’s rapid economic growth rates. • Industrial exports and greater monetary transparency—which has • encouraged foreign investment—are driving China’s economic expansion.
Economic Growth-Analysis Russia Brazil • Petroleum exports are Russia’s main engine of economic growth; high world oil prices, improved consumer confidence, and domestic demand boost economic growth • Greater tax compliance has increased government revenue; effective fiscal policy has promoted macroeconomic stabilization and long-term growth • Despite efforts from the government to impose economic reform, GDP growth has remained low; • Brazil’s challenge will be to boost growth during the current decade. China • The majority of China’s growth is fueled by external trade and FDI. • The Chinese industrial sector is experiencing increases in productivity. • Productivity increases (and consequent output increases) are the • main factor leading to high growth rates • The expanding private sector helps boost the Chinese economy India • Increasing expansion of the services sector and growth in foreign direct investment are India’s main engines of economic expansion. • Increasing literacy rates and education achievement help explain increasing productivity and GDP growth.
Trade Russia Brazil Global Trade partners US -17%, Argentina 7.2%, Netherlands 3.8% China 5.0% Global Trade partners Netherlands -10.1%, Italy 7.8%, Germany 8.1% China 5.4% Net Goods Trade- $35606 Net Services Trade- ($13730) Net Goods Trade- $99434 Net Services Trade- ($14357)
Trade China India Global Trade Partners US -17%, UAE-8.3%, China- 7.7% UK- 4.3% Global Trade Partners US-10.1%, Hongkong- 7.8%, Japan- 8.1% South Korea- 5.4% Net Goods Trade- ($99503) Net Services Trade- $44607 Net Goods Trade- $303333 Net Services Trade- ($15480)
Conclusion • Due to strong overall macroeconomic fundamentals in BRIC, there will be substantial flows of foreign investment boosting potentials for the future output growth. • The BRICs are likely to maintain their comparative advantages in the long term. This will help to ensure relatively high growth rates and therefore increasing share of these economies in the world market.
According to Goldman Sachs, the • world’s largest economy in 2050 will be China which is expected to be almost 30% larger than the US • US will be the world’s second largest • economy by then. • However other Asian nations are more significant than Russia and Brazil combined. • Also sustainability of high growth will depend on the several crucial factors: • Sound and stable macroeconomic and development policies. • Development of strong and capable institutions (including political). • Human development (improved healthcare and education).
Thank You Presented By: