Download

1 / 38
380 likes | 525 Views
Sequential Sampling Designs for Small-Scale Protein Interaction Experiments. Denise Scholtens, Ph.D. Associate Professor, Northwestern University, Chicago IL Department of Preventive Medicine, Division of Biostatistics Joint work with Bruce Spencer, Ph.D .

E N D
Sequential Sampling Designs for Small-Scale Protein Interaction Experiments Denise Scholtens, Ph.D. Associate Professor, Northwestern University, Chicago IL Department of Preventive Medicine, Division of Biostatistics Joint work with Bruce Spencer, Ph.D. Professor, Northwestern University, Evanston IL Department of Statistics and Institute for Policy Research
Large Scale Protein Interaction Graphs • Often steady-state organisms • E.g. Saccharomyces cerevisiae, various interaction types • Gavin et al. (2002, 2006) Nature, Ho et al. (2002) Nature, Krogan et al. (2006) Nature, Ito et al. (1998) PNAS, Uetz et al. (2000) Nature, Tong et al. (2006) Science, Pan et al. (2006) Cell • Topology • Modular organization into complexes/groups • Bader et al. (2003) BMC Bioinformatics, Scholtens et al. (2005) Bioinformatics, Zhang et al. (2008) Bioinformatics, Qi et al. (2008) Bioinformatics • Global characterization as small-world, scale-free, hierarchical, etc. • Watts and Strogatz (1998) Nature, Barabási and Albert (1999) Science, Sales-Pardo et al. (2007) PNAS • Measurement Error • False positive/negative probabilities • Chiang et al. (2007) Genome Biology, Chiang and Scholtens (2009) Nature Protocols • Mostly large graphs • 100s-1000s of nodes • 1000s-10,000s of edges Fig. 4, Gavin et al. (2002) Nature Top panel Nodes: protein complex estimates Edges: common members Bottom panel Nodes: proteins Edges: complex co-membership (often called indirect interaction)
Sampled data Three bait:prey pull-downs from Gavin et al. (2002) Apl5: Apl6, Apm3, Aps3, Ckb1 Apl6: Apl5, Apm3, Eno2 Apm3: Apl6, Apm3 One AP-MS `pull-down’ bait prey Eno2 untested: ? AP-MSdata capture bait-prey relationships: a bait finds ‘interacting’ prey with common membership in at least one complex Apl6 Apl6 Aps3 Apm3 Apl5 Apl5 Ckb1 tested: absent Maximal cliquesmap to protein complexes: when all proteins are used as baits, all nodes have edges to all other nodes in the clique, and the clique is not contained in any other clique NOTE: Failure to test all edges means we typically cannot identify maximal cliques
Inference using a portion of possible baits B C Two protein complexes with physical topologies shown by black edges D A A F E If the AP-MS technology works perfectly (I.e. no false positives or false negatives)… 2 Baits: AB 3 Baits: ABC 6 Baits: ABCDEF 1 Bait: A B B B B F D F D F D F D A A A A C E C E C E C E 9 tested edges 7 present 2 absent 6 untested edges 12 tested edges 8 present 4 absent 3 untested edges 15 tested edges 9 present 6 absent 5 tested edges 5 present 0 absent 10 untested edges
Smaller-scale studies • What if we are interested only in a portion of the graph? • Cataloguing complexes/ describing the local neighborhood for a pre-specified set of starting baits • Comparing local neighborhoods for different sample types • disease vs. normal • treated vs. untreated Starting bait of interest Interesting neighbor Less interesting neighbor Uninteresting neighbor
Link tracing designs(or snowball sampling) • Start with a set of nodes as starting baits (S0) • Identify interacting partners • Use interacting partners as new set of baits, excluding those already used as baits • Identify their interacting partners • Etc…. S0 S1 S2 S3
Link tracing notationAdapted from Handcock and Gile (2010) Annals of Applied Statistics
Link tracing notationAdapted from Handcock and Gile (2010) Annals of Applied Statistics
A simple scheme • Let m remain constant over all sampling waves, e.g. choose a fixed proportion p of all eligible baits at each wave. • This leads to a simplification in the probability of observing a specific sample. In particular, n Pr(Sm= sm | Em,m) = π (pEmi)smi((1-pEmi))(1-smi) i=1
Sampling 1/4 of all eligible baits… S0 = {n1,n2,n3} E1 = {n4,n6,n12,n13,n14,n15,n16,n17} S1 = {n4,n12} E2 = {n6,n13,n14,n15,n16,n17,n34,n35, n36,n37,n38,n59,n97,n98,n99n100,n194} S2 = {n15,n59,n97,n98,n99} Etc… Note that we do not cover all portions of the graph that we would with a full snowball sample.
Negative binomial • In this setting, a path of length l extending from one of the starting baits follows a negative binomial distribution for being tested (and therefore observed) in m rounds of sampling (0 < l ≤ m). Pr(observing a path of length l in m rounds) = ( )pl(1-p)m-l m=l,l+1,… m-1 l-1 Test all 3 nodes/edges in 3 rounds: p p p 1-p p p p Test 3 nodes/edges in 4 rounds:
Cumulative probabilities • The cumulative probability for observing paths with nodes that are sampled early on is higher than those that enter later. • When nodes are tightly grouped in cliques, this can lead to over-sampling in regions of the graph with high-confidence clique estimates. • Ie, we may be ‘satisfied’ with a clique estimate that has a certain proportion of tested edges, but if the involved nodes are identified early in the process, chances are they will eventually enter the sample…so how can we move on and sample other areas? • There is also great dependency among joint probabilities of testing any pair (or larger collection) of paths, especially among nodes with common paths extending from the starting baits.
Tested fraction of edges • In addition, we are interested in complexes with a certain proportion of tested edges out of those that are possible, not necessarily a proportion of tested baits (although they are related) 2 Baits: AB 3 Baits: ABC 6 Baits: ABCDEF 1 Bait: A B B B B F D F D F D F D A A A A C E C E C E C E 9 tested edges 9/15 = 3/5 tested 12 tested edges 12/15 = 4/5 tested 15 tested edges 9 present 6 absent 5 tested edges So 1/3 of possible edges are tested
Edge imputation • Assume a simple edge imputation scheme in which untested edges are assumed to exist if the involved prey share at least one common bait. • This is consistent with high clustering coefficients observed for these types of graphs as well as existing clique estimation algorithms on partially observed graphs. • A complex (or clique) estimate may be considered ‘high quality’ if more than half of the involved edges are tested and observed. High Quality: 9/15=0.6 edges observed Low Quality: 13/28=0.46 edges observed
Tested fraction of edges • In a collection of nodes involving b baits and q prey-only nodes with no measurement error for edge observations, we have: b(b-1)/2 tested edges among baits bq tested edges among bait-prey pairs (b+q)(b+q-1)/2 possible edges among all nodes • So then the proportion of observed edges is b(b-1) + 2bq (b+q)(b+q-1)
A modification: capturing dependency among nodes B C Two protein complexes with physical topologies D A A F E Affiliation matrix: nodes to cliques Incidence matrix among nodes Corresponding AP-MS graph B A = Y = AAT = Boolean algebra: 1+1=1*1=1+0=1 0+0=0*0=0*1=0 F D A C E
Strata:Nodes with identical adjacency AP-MS graph B Y = F D A C E
All nodes with matching colors on the previous slide are connected to each other, and have matching sets of adjacent nodes • In some sense, they contain ‘redundant’ information • And in a measurement error setting, extremely highly correlated information • If we know the strata, and we know the set of adjacent nodes for one member node, then we know the set of adjacent nodes for all other strata constituents • For sampling purposes, it seems reasonable to represent these subpopulations by design
AP-MS graph B A = Y = AAT = Boolean algebra: 1+1=1*1=1+0=1 0+0=0*0=0*1=0 F D A C E Affiliation matrix: nodes to strata Affiliation matrix: strata to cliques BDF X = Q = A CE
Note the following properties: QQT is the incidence matrix among strata XQ = A XQ(XQ)T = AAT = Y
Stratified sampling • The idea: use estimated strata to inform sampling • Maintain a constant fraction of tested edges within each estimated strata • This will help identify strata and summarize their connectivity to other strata • It will also help focus our resources in areas that require more observations as opposed to those that have been adequately sampled according to some desired threshold for the fraction of tested edges
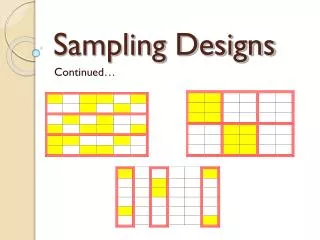
Stratified sampling Testing at least half of the edges within a stratum with 10 member nodes: At least 3 baits are required Have 1 bait Choose 2 more baits Have 2 baits Choose 1 more bait Have 4 baits Don’t sample from this stratum (or do so with small probability)
Stratified sampling • While the strata and the fraction of tested edges within them determine the number of additional baits to include, the samples do also include observations of edges connecting pairs nodes in different strata Tested edge within strata Tested edge between strata
Stratified sampling • Algorithm: • Specify starting baits S0 and form E1 • Impute edges among prey-only nodes with at least one common bait • Estimate strata according to matching adjacency in Y1 to form X1 • Calculate fraction of tested edges for each stratum determined by X1 • Determine number of additional baits required for each stratum and sample accordingly to form S1 • Repeat • At each step k, we can also estimate Qk, Yk and/or Ak
A comparison:Threshold sampling • Similar to the simple random sampling scheme introduced earlier • Rather than specifying a set proportion of baits to test, sample the appropriate number to test a certain fraction of all possible edges in the graph given the identified nodes
Simulation:In silico Interactome • We used the ScISI Bioconductor package to create an ‘in silico interactome’ containing protein complex data reported in the Cellular Component Gene Ontology and at MIPS for Saccharomyces cerevisiae. • The largest connected component of the resultant graph contains 1404 nodes and 86609 edges. • 197 protein complexes are represented with a range of sizes from 2 to 308 (median 18).
Simulation Study • Compared stratified(str) and threshold (thresh) sampling schemes • Specified tested fractions of 1/10 and 1/20 of all possible edges • Called a complex ‘high quality’ if at least 1/2 of the edges were tested • For each iteration, randomly chose 3 nodes with close proximity as starting baits • 250 rounds for each scheme
Cumulative number of baits mean number of complexes
Discussion • Large-scale protein interaction experiments are very costly and may not be of interest in smaller lab settings or for investigations of particular cellular functions • As long as we are comfortable with some estimation of untested edges, sampling identified prey to create the next bait set may yield considerable savings
Discussion • Using estimated sampling strata seems to provide a greater balance of resource allocation across the graph • Work still in progress suggests that this is due to a reduction in cumulative sampling variability across the graph • As long as the per-bait cost is less than the per-sampling-round cost, stratified sampling appears to be a better approach
Extensions • Measurement error can be easily included in specification of Em, and adaptations of clique identification (e.g. the penalized likelihood method in Bioconductor’s apComplex) can be used instead of straightforward imputation • This would also be a natural starting point for adaptively designing experiments to compare different sample types