Download
1 / 14
140 likes | 277 Views
European Union emission inventory report 1990–2011 under the UNECE Convention on Long-range Transboundary Air Pollution (LRTAP) EU LRTAP inventory team 2013:

E N D
European Union emission inventory report 1990–2011 under the UNECE Convention on Long-range Transboundary Air Pollution (LRTAP) EU LRTAP inventory team 2013: Sabine Schindlbacher., Michael Gager, Simone Haider, Melanie Tista, Robert Wankmüller (ETC/ACM), Martin Adams and John van Aardenne (EEA). TFEIP 2013 meeting, Istanbul, Turkey.
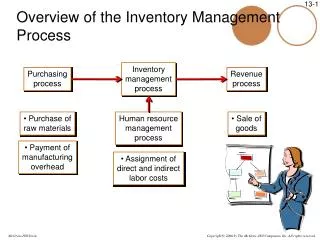
Inventory preparation process The reporting guidelines describe the data that parties should report under the LRTAP Convention and its protocols. Within the EU, Member States are requested each year (under the agreement between Eionet countries and the EEA concerning priority data flows) to post a copy of their official submission to the LRTAP Convention in the CDR, by 15 February. The ETC/ACM subsequently collects the data from the CDR and compiles the gap-filled EU LRTAP Convention emission inventory database and produces a EU LRTAP Convention emission inventory and inventory report. Member States can provide comments to EU inventory data and inventory report (deadline May 6). April 30, European Commission submits data (NFR) to LRTAP convention May 30, European Commission submits IIR and (potential) updated NRF to LRTAP convention The inventory and accompanying documentation are subsequently made publicly available through the EEA website
Main changes compared to last year´s report • Implementation of the recommendation of the Expert Review Team given in the frame of the Stage 3 review, • The section on the general assessment of completeness was extended • Further, a new section on underestimations was included in the report • Information on gap-filling and non-availability of data were included to the trend tables • The procedure to check data submitted by Member States was described in detail • This year for the first time the quantitative uncertainty estimates provided by Member States are presented in this report • No changes, although suggested, international/domestic transport and quantitative EU level uncertainty analysis
Status of reporting by Member States (as of 9 March 2013) Preparation of EU inventory report started with 8 IIR´s missing. Questions asked to MS Review processes allowed MS to provide feedback
Gap filling procedure: most frequent problems observed in MS data • • Submissions (whole national inventory) are not provided for the most recent year and/or other years. • • Emissions of some pollutants (e.g. PM, HMs, POPs and NH3) are not provided, for a single year, several years or the entire time- series. • • Sectoral emissions are missing and only national totals are provided. • Gap-filling procedure performed in accordance with a methodology paper developed by the EEA and ETC/ACM. • See presentation by Robert Wankmüller (ETC/ACM) at Monday´s workshop on gap-filling procedure
Effect of gap-filling on EU national total emission data for the year 2011 (draft data, refer to national totals)
Uncertainty Quantitative uncertainty estimates provided by Member States are presented in this report 9 countries quantify uncertainties: Cyprus, Denmark, Finland, France, Germany, Latvia, the Netherlands, Sweden and the United Kingdom. Member States use either a tier 1 approach or a Monte Carlo analysis (Finland and the United Kingdom). The pollutants considered and the assumptions behind the uncertainty analysis vary between the Member States: some example on level uncertainty NOx: 10-74% SO2: 4 – 88% PM2.5: 15-349% NMVOC: 10-85% It is not possible to evaluate uncertainty at the overall EU level
Completeness of reporting of NFR templates submitted by Member States for main pollutants, PMs and CO (before gap filling)
Completeness of reporting of NFR templates submitted by Member States for main HMs (before gap-filling)
Comparison of emissions reported for 2011 by EU-15 Member States with emission ceilings for the EU specified in the UNECE Gothenburg Protocol (draft data)
Total EU-27 emissions of the main air pollutants, HMs, POPs and PM (draft data)
Potential underestimation in the inventory (some examples) A simple assessment was made of the underestimation in national emission inventories that may occur due to the use of the notation key ‘NE’ by Member States. The main intention of the analysis is to encourage Member States to review source categories reported as ‘NE’ and in future provide estimates, especially where these sources may add significantly to the currently reported national totals. Method Source categories reported as ‘NE’ in national inventories were assumed to contribute as much to the national total of the Member State compared to countries that do report data for the specific category. High values: CU (2 x 85%), Se (2 x 97%, 51%), CO (1x 85%), total PAHs (1x 98%) Other notable findings: Nox (1x 13%), NMVOC (1x 15%), PM2.5 (1x 6%)
Linking back to Monday´s discussion: learning from other countries/gap-filling