Download
1 / 24
240 likes | 431 Views
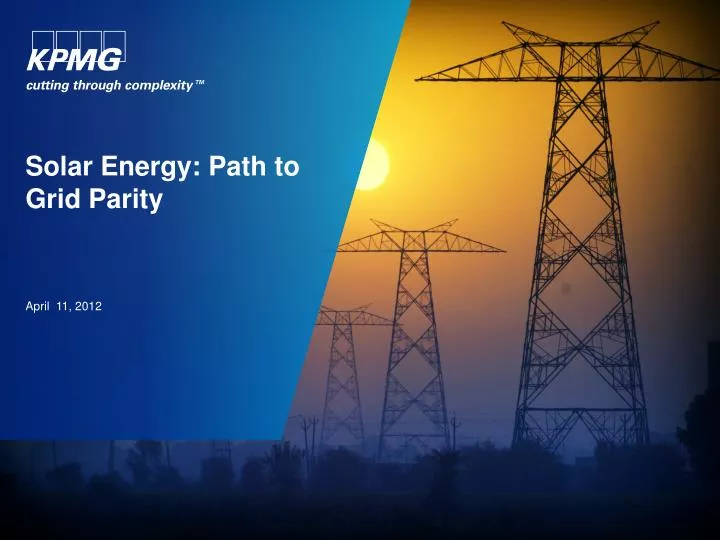
Solar Energy: Path to Grid Parity. A pril 11, 2012. Contents. Why Solar? Why Solar in India?. What is Stopping Solar?. Policy Focus – State and Center. Our Point of View: Grid Parity. A small piece of land in Rajasthan can mee t the power requirement of India!. Infinite Source.

E N D
Solar Energy: Path to Grid Parity April 11, 2012
Contents Why Solar? Why Solar in India? What is Stopping Solar? Policy Focus – State and Center Our Point of View: Grid Parity
A small piece of land in Rajasthan can meet the power requirement of India!
Three things will drive solar power in India Large Incremental Power Demand Well endowed solar radiation – among the best in the world Emerging grid parity • India needs to add: • 80 GW (conventional power equivalent) in next five (5) years • 200 GW (conventional power equivalent) in next ten (10) years
Three things will drive solar power in India India’s solar insolation ~ 1800-2000 kwh/m2/year Large Incremental Power Demand Well endowed solar radiation – among the best in the world Emerging grid parity Operating hours KWh/KWp Top 10 PV Markets - 2010 Selected countries in Sunbelt India 2,000 South Africa Chile Egypt Brazil 1,800 Average Irradiation Sunbelt Italy China China Spain Australia SouthKorea Indonesia Japan USA 1,200 France Czech Rep. Belgium 900 Germany
Three things will drive solar power in India Large Incremental Power Demand Well endowed solar radiation – among the best in the world Emerging grid parity With our analysis of grid parity suggesting 2017 to 2019 timeframe, we expect solar power to start making significant contributions to incremental demand by 2015
Contents Why Solar? Why Solar in India? What is Stopping Solar? Policy Focus – State and Center Our Point of View
Contents Why Solar? Why Solar in India? What is Stopping Solar? Policy Focus – State and Center Our Point of View
Proactive Government Support for Solar Market…. Power Purchase Agreement (PPA) – Subsidy Driven Market Driven I II III Jawaharlal Nehru National Solar Mission (JNNSM) State level solar programs Renewable Energy Certificate (REC) Market • Grid Connected:Phase – 1: • 1000 MW by 2013(500 MW of Solar thermal) • 20,000 MW by 2022 • Rooftop & Small Scale Solar Power Generation100 MW already allotted • Off-grid & Decentralized Solar ApplicationsMarket size of 200 MW by 2013 • Several states have come out with solar power policies to encourage deployment of solar power. • Gujarat: Signed PPA's for about 965 MW of solar power. • Rajasthan: • Phase-1 (up to 2013) • Maximum Capacity to be developed 200 MW • Phase-2 (2014 -2017) • Maximum Capacity to be developed 400 MW (Additional) • Developers can trade REC with utilities that are short of the mandated quota of renewable energy for each state in the power exchange • REC market started trading in India
6.6 – 6.4 5.6 – 5.4 6.4 – 6.2 5.4 – 5.2 6.2 – 6.0 5.2 – 5.0 6.0 – 5.8 5.0 – 4.8 5.8 – 5.6 4.8 – 4.6 4.6 – 4.4 State Policies Certain States are active in the Solar space…. India – Radiation Map (kWh/m2/Day) • Rajasthan • MOU with Clinton Climate Initiative (CCI) for developing 3000-5000 MW in Solar Parks • Feasibility study being done • State Solar Policy (2011): • Targets 600 MW of generation capacity by 2017 West Bengal • India’s first grid integrated 1 MW solar power plant at Asansol. • Targets more than 100 MW by 2012. Gujarat • PPAs totaling 965 MWs signed • Executing First Solar Park (~350 MW) in India that will be operational in 2011 • Pre feasibility study for Second Solar Park being undertaken Andhra Pradesh • Emerging as a key Solar Manufacturing hub with players like Solar semiconductor, Surana, Suryachakra, Xl Telecom and Titan energy systems. • Land banks for solar projects have been identified in 12 districts. Source: TERI …several states have signed MOUs and PPAs with developers for setting up solar power plants 13
REC MechanismOption to sell renewable energy in REC market has been a major incentive for RE generators Sell the ‘renewable energy’ at preferential tariff fixed by the concerned Electricity Regulatory Commission to an entity At least 250kW grid connected renewable energy projects Renewable energy at preferential tariff Obligated entities Option 1 Discoms Captive power consumers Open access consumers Other obligated entities RE Generator Environmental Attributes Solar Power Exchange Option 2 Non- Solar RE C REC Mechanism Small Hydro Wind Solar Biomass Urban or municipal waste All other sources recognized or approved by MNRE Host distribution utility Third party sale Captive power plant Power exchange Price not exceeding pooled cost of power Electricity Mutually agreed price Commodity Market determined price through power exchange Sell the ‘electricity generation’ to one entity and the ‘environmental attributes associated with renewable energy generation in the form of RECs’ separately through the market based mechanism like REC to any Obligated Entities
REC values the renewable energy attribute of electricity generated from renewable energy based projects Price of REC is discovered in the power exchange based on the demand and supply of the RECs in the market, subject to a forbearance price (ceiling price) and floor price determined by CERC No solar RECs have been traded so far. Currently, non-solar RECs are being actively traded on both the exchanges (IEX and PXIL) and trading of Solar RECs are also expected to commence soon. REC Mechanism Floor and forbearance price for Solar RECs has been fixed till FY15 at INR 9,880/MWh and INR 13,690/MWh respectively • Solar • INR 13,690/MWh • Non- Solar • INR 3,480/MWh Forbearance price Ceiling price within which certificates can be dealt Pricing of RECs as per REC framework • Basic minimum requirements for ensuring the viability of RE projects set up to meet the RE targets cover loan repayment & interest charges, O&M expenses and fuel expenses in case of Biomass and Cogeneration • Highest difference between cost of generation of RE technologies / RE tariff and the average power purchase cost of 2010-11 for the respective states Applicable from 1st April 2012 Floor price Minimum price above which certificates can be dealt • Solar • INR 9,880/MWh • Non- Solar • INR 1,400/MWh Source: CERC, NLDC, REC Registry of India
Contents Why Solar? Why Solar in India? What is Stopping Solar? Policy Focus – State and Center Our Point of View
Solar Power in India Market Potential is Significantly Large • We expect the Solar Market to be about 68 GW by 2022 unlike JNNSM target of 20 GW • We forecast 36% of the 56 GW market (from 2017-18) to come from utility-scale solar potential • Solar rooftops and solar-powered agriculture pump-sets may require government interventions to encourage solar adoption • However, utility-scale solar installations would be driven by cost economics of solar power 17
Solar Grid Parity – When?The point at which grid parity occurs is a function of the rate of increase in conventional power prices and the rate of decrease in solar prices • We expect landed cost of conventional energy to consumers to increase over the next decade at the rate of 4% p.a. in base case and 5.5% p.a. in an aggressive case • This factors in increasing proportion of raw material imports, cost of greenfield generation and network assets and improvements in operational efficiencies of the utilities • We expect solar prices to decline at the rate of 5-7% p.a over the next decade • This factors in increasing economies of scale in equipment manufacturing and advancements in product technology thereby improving solar-to-electricity conversion efficiency Note: We expect to reach grid parity in about the same time in the case of CSP too
Solar Grid Parity – Rooftop MarketThe difference between the landed cost of power and the solar power price at consumer end is on the decline ILLUSTRATION • For large scale commercial and industrial establishments the gap between solar power and tariffs is already very low
Solar Grid Parity – Decentralized ApplicationsSolar power is already economical when compared to diesel powered applications market ILLUSTRATION • Today, Solar power price is competitive with the effective price of diesel based power for applications like telecom towers, agricultural pumpsets • India has about 17 mn grid powered pumps and close to 7 mn diesel powered pumps* - Only 7,500 solar pumping systems have been installed for agricultural use • Market Potential *Source: Energy Alternative India (EAI)
Solar Power in India Decentralized Stand-alone Applications can contribute 65% of the total demand during 2017-22 Solar Powered Agricultural Pumpsets 16,000 MW by 2022 Solar Water Heaters 70 million sqm of collector area by 2022 Solar Powered Telecom Towers 3,500 MW by 2022 Solar rooftops 19,000 MW by 2022
Solar Power in India Indian solar sector offers significant investment opportunities Solar Investments in India Solar Specific Vendor Market Supporting Industries (Source: KPMG’s Solar Market Size Model)
According to a KPMG study, these three drivers could mean the following… • Solar power can potentially meet 7% of India’s power requirement in next ten years • It can mitigate 2.6% of India’s carbon emissions • It can enhance India’s energy security by reducing dependence on energy imports • Oil imports stand at around 75% • Coal imports expected to increase from 15% to 30% in next 5 years • Solar energy can offset 20% of India’s coal imports and save 5% of India’s diesel consumption annually within 10 years, which can result in cumulative savings of USD 25 billion over the next 10 years