Download
1 / 40
400 likes | 470 Views
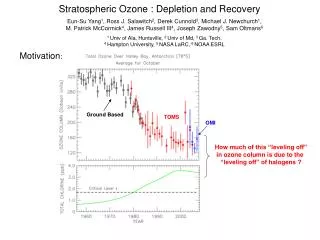
STRATOSPHERIC OZONE DISTRIBUTION. Marion Marchand CNRS-UPMC-IPSL. SHAPE OF OZONE PROFILE. Altitude (km). UV. J O2 (s -1 ). Altitude (km). O 3 (molecules.cm -3 x 10 -12 ). Photolysis coefficient (s -1 ). O 2 (molecules.cm -3 x 10 -19 ).

E N D
STRATOSPHERIC OZONE DISTRIBUTION Marion Marchand CNRS-UPMC-IPSL
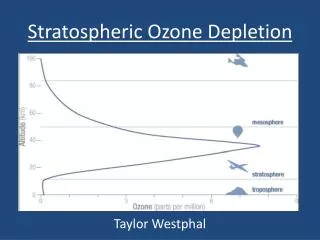
SHAPE OF OZONE PROFILE Altitude (km) UV JO2 (s-1) Altitude (km) O3 (molecules.cm-3 x 10-12) Photolysis coefficient (s-1) O2 (molecules.cm-3 x 10-19) O2 + UV-c -> O + O O + O2 + M -> O3 + M d[O3]/dt =2JO2 [O2]
O3 [O3] [M] [O3] concentration (molec.cm-3 x 10-12) [M] total air concentration (molec.cm-3x 10-16) VMR (Volume Mixing Ratio)=[O3]/[M] (-> better indicator of chemistry )
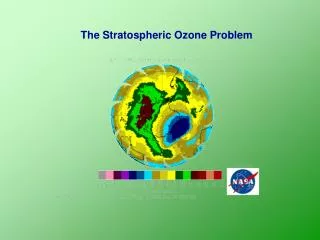
O3 column (Dobson units) O3 production from O2 photolysis (molec.cm-3) tropical maximum latitude tropical minimum Altitude (km) latitude Why? month Brewer (1949) quotes from Dobson et al. (1929): 'The only way in which we can reconcile the observed high ozone concentration in the Arctic in spring and the low concentration in the tropics, with the hypothesis that the ozone is formed by the action of the sunlight, would be to suppose a general slow poleward drift in the highest atmosphere with a slow descent of air near the poles. Such a current would carry the ozone formed in low latitudes to the poles and concentrate it there. If this were the case the ozone at the poles would be distributed through a moderate depth of atmosphere while that in low latitudes would all be high up.’ [SPARC]
Temperature (°K) stratopause Troposphere is humid but stratosphere is very dry. Why? very dry statosphere tropopause humid troposphere Brewer (1949) said `The observed distributions of water vapour can be explained by the existence of a circulation in which air enters the stratosphere at the equator, where it is dried by condensation, travels in the stratosphere to temperate and polar regions, and sinks into the troposphere.' [SPARC]
months dO3/dt~f(dynamics) dO3/dt = f(chemistry + dynamics) dO3/dt~f(chemistry) hours days months
CHEMISTRY OF OZONE: CONCEPTS
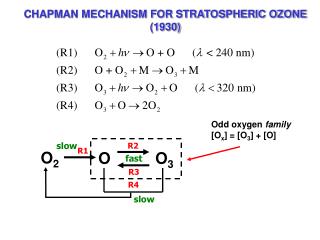
OXYGEN-ONLY CHEMISTRY ° First chemistry scheme proposed by Chapman in 1930, also called the ‘Chapman cycle’. ° The reactions are O2 + h→ O + O jO2 < 242 nm O + O2 + M → O3 + M kO+O2 O3 + h→ O + O2 jO3 < 336 nm O + O3 → O2 + O2 kO+O3
O2 + h→ O + O O + O2 + M → O3 + M O3 + h→ O + O2 O + O3 → O2 + O2 d[O3]/dt = kO+O2.[O2].[O].[M] -JO3.[O3] -kO+O3.[O3].[O] d[O]/dt = 2.JO2.[O2] +JO3.[O3] -kO+O2.[O2].[O].[M] -kO+O3.[O3].[O]
ODD OXYGEN CHEMICAL FAMILY fast ° kO+O2 et JO3interconvert O3 and O very rapidly, so introduce new species Ox[=O + O3] known as “odd-oxygen” fast slow slow d[Ox]/dt = d[O]/dt + d[O3]/dt = 2.JO2.O2 - 2.kO+O3.O3.O Production - Destruction If Ox steady-state (i.e. d[Ox]/dt = 0), JO2.[O2]= kO+O3.[O3].[O]
Mass balance for atomic oxygen O: d[O]/dt = 2.JO2.[O2] +JO3.[O3] -kO+O2.[O2].[O].[M] -kO+O3.[O3].[O] ° if Ox steady-state (i.e. d[Ox]/dt = 0), JO2.[O2]= kO+O3.[O3].[O] -> d[O]/dt = JO2.[O2] +JO3.[O3] -kO+O2.[O2].[O].[M] ° interconversion terms >> net chemical terms (chemical family approach): JO3.[O3] >> JO2.[O2] -> d[O]/dt ~ JO3.[O3] -kO+O2.[O2].[O].[M] ° lifetime of O = [O]/loss = 1/(kO+O2.[O2].[M]) < 1 sec -> O steady-state (i.e. d[O]/dt = 0), [O]/[O3] = JO3 / (kO+O2.[O2].[M]) ° as expected, interconversion terms determine partitioning within chemical family
Altitude (km) O O3 Volume mixing ratio ° Chapman’s model of [O]/[O3] validated against observations ° [O]/[O3] << 1 -> Ox[=O + O3] ~ O3 and d[Ox]/d= d[O3]/dt
° if Ox steady-state (i.e. d[Ox]/dt = 0), JO2.[O2]= kO+O3.[O3].[O] ° if O steady-state (i.e. d[O]/dt = 0), [O]/[O3] = JO3 / (kO+O2.[O2].[M]) ° using [O]=f([O3]) expression in JO2.[O2]= kO+O3.[O3].[O], [O3] = [O2] . (kO+O2.[M] / kO+O3)1/2 . (JO2 / JO3 )1/2 with [O2] =0.21 [M]
Calculated [O3] from Chapman’s model is much too high compared to observations. Why? d[O3]/dt = JO2.[O2] - kO+O3.[O3].[O] calculated observed
OZONE DESTROYING CATALYTIC CYCLES ° Bates and Nicolet introduced in 1950 the idea of ozone being destroyed via the following catalytic cycle: OH + O3→ HO2 + O2 HO2 + O → OH + O2 net: O + O3 → O2 + O2 ° NO2 cycle in 1970 by Crutzen and also Johnston NO + O3→ NO2 + O2 NO2 + O → NO + O2 net: O + O3 → O2 + O2
° ClO cycle in 1974 by Stolarski and Cicerone. Cl + O3→ ClO + O2 ClO + O → Cl + O2 net: O + O3 → O2 + O2 ° A general form: X + O3→ XO + O2 fast XO + O → X + O2slow net: O + O3 → O2 + O2 with X, the catalyst, being radical H, OH, NO, Cl or Br ° slow reaction is the limiting step in the cycle, d[O3]/dt ~ - 2.kXO+O.[XO].[O]
Catalyst: H, OH, NO, Cl, Br,.. d[O3]/dt ~ +2.JO2.[O2] -2.kO+O3.[O3]. [O] -2.kHO2+O3. [HO2]. [O3] -2.kNO2+O. [NO2]. [O] -2.kHO2+O3. [ClO]. [O]
STRATOSPHERIC SOURCE GASES The key stratospheric source gases are long-lived in the troposphere, and hence, once emitted at the surface, they can reach the stratosphere ° Stratospheric hydrogen radicals (OH, HO2) originate mostly from H2O injected from the troposphere and from the in-situ oxidation of (natural and anthropogenic) CH4 by, O(1D) + H2O → OH + OH O(1D) + CH4→ OH + CH3 --> more oxidation, more OH ° Most of the stratospheric nitrogen oxide radicals (NO2, NO) originates from N2O oxidised in the stratosphere via the following reaction, O(1D) + N2O → NO + NO
STRATOSPHERIC SOURCE GASES ° Stratospheric chlorine radicals (Cl, ClO) originate mostly from CFCs that are photolysed by UV radiation following, CFxCly + h→ Cl + CFxCl(y-1)--> more oxidation, more Cl
° Sources of stratospheric chlorine radicals (Cl, ClO) anthropogenic natural
RESERVOIR SPECIES ° Up to now, we considered the different catalytic cycles independently. But radicals from one chemical family can interact with radicals from another family. ° Reactions between radicals lead to formation of species with longer lifetimes, much less reactive, called reservoirs, e.g. ClO + HO2 → HOCl + O2 HO2 + NO2 + M → HO2NO2 + M ClO + NO2 + M → ClONO2 + M OH + NO2 + M → HNO3 + M NO3 + NO2 + M → N2O5 + M ° Reservoir species can be dissociated back rather quickly to release ozonedestroying radicals
CHEMICAL MODEL O3 BUDGET : Production - Destruction d[O3]/dt = 2 JO2 [O2]-2 k[XO][O]with X=O2, OH, NO, Cl ClOx (CFCs) O/O3 cycle NOx (N2O) HOx (CH4,H2O) production/destruction rate (molec.cm-3.s-1) O3=f(X, altitude)
° complete destruction between 14 and 22 km ° - d[O3]/dt ~2 %/day ozone abundance (mPa)
PSC clouds formed at T < ~193 K by co-condensation of HNO3 and H2O
-> speed up reactions that are are very slow or non-existent in the gas-phase Heterogeneous chemistry: ° chlorine activation (reservoirs species -> into chlorine radicals) ° O3 destruction Ice or HNO3/H2O PSCs
CATALYTIC CYCLES OF POLAR OZONE DESTRUCTION ° BUT observed loss rates (- d[O3]/dt) ~2 %/day -> [O] is much too low (not enough sunlight during early spring) for ClO+O cycle to account for observed loss rates. ° Cl2O2 cycle in 1987 by Molina and Molina. ClO + ClO + M Cl2O2 + M equilibrium Cl2O2 + h→ Cl + ClOO ClOO + M → Cl + O2 + M 2 x ( Cl + O3→ ClO + O2 ) -> little sunlight is required (fast JCl2O2) and more efficient at low temperatures because it slows down thermal decomposition of Cl2O2 (Cl2O2 → ClO + ClO)
° ClO-BrO cycle ClO + BrO → Cl + Br + O2 slow Cl + O3→ ClO + O2 fast Br + O3→ BrO + O2 fast net: O + O3 → O2 + O2 -> little sunlight is required because the cycle does not involve atomic oxygen O ° Polar ozone loss rate: d[O3]/dt ~ -2.JCl2O2. [Cl2O2] -2.kClO+BrO.ClO.BrO
high chlorine loading and very cold/ isolated polar vortex
Effet de Serre Bilan au niveau de la Terre sans effet de Serre (loi de stefan): = Ts = 255 K seulement ! Bilan au niveau de la Terre + effet de Serre: = _ 2 + = Bilan au niveau de la couche (loi Kirchhoff): a = 2
Stratospheric cooling / heating rate (K/day) stratopause tropopause Temperature Heating: O3 + UV → O + O2 O + O2 + M → O3 + M (Q) -> dT/dz > 0 Cooling: mainly CO2 +/- IR H2O and O3 significant
Relation-1 O3 - T : O3 + UV → O + O2 O + O2 + M → O3 + M (Q) => d(O3)/dt > 0 -> d(T)/dt > 0 Relation-2 O3-T: O + O3 → O2 + O2 k = 2.e-11 *exp( -2350 / T) Quand T diminue => ralentissement destruction O3 =>d(T)/dt > 0 -> d(O3)/dt < 0 ~ 45 km O3 and T strongly coupled: d(O3)/dt > 0 -> d(T)/dt > 0 -> attenue le d(O3)/dt > 0 d(T)/dt > 0 -> d(O3)/dt < 0 -> attenue le d(T)/dt > 0
Greenhouse gas changes Ozone changes total
-0.15 Wm-2 • Diminution O3-strato modifie l’équilibre radiatif à la tropopause • effet sur la T au sol : • Augmentation de la pénétration des UV dans le système surface-troposphère • (Forçage positif) • Sans ajustement de T: réduction des émissions IR de corp noir vers la surface • (Forçage négatif) • Avec ajustement de T: diminution de l’absorption du rayonnement UV par l’O3 => refroidissement de la stratosphère => réduction de l’émission des corps noirs vers le sol (Forçage négatif)
COMPLEXITY OF INTERACTIONS DYNAMICS (T, winds) CHEMISTRY CCM O3, CH4 RADIATION CO2 CTM + GCM = CCM (Chemistry-Climate Model) -> predict the future evolution of ozone layer
Future O3 = f(CFCs, greenhouse gases) Montreal process: chlorine loading -> ozone layer Kyoto process greenhouse gases -> climate