Download
1 / 24
240 likes | 311 Views
PNW-FIA Quality Assurance QA Reloaded. The Road from Periodic to Annual Datasets PNW-FIA Client Meeting, March, 15 2005. QA Definitions. QA is: A light and bouncy subject engaging staff at all levels with incentives to get the job done right the second time. Or:. QA Definitions.

E N D
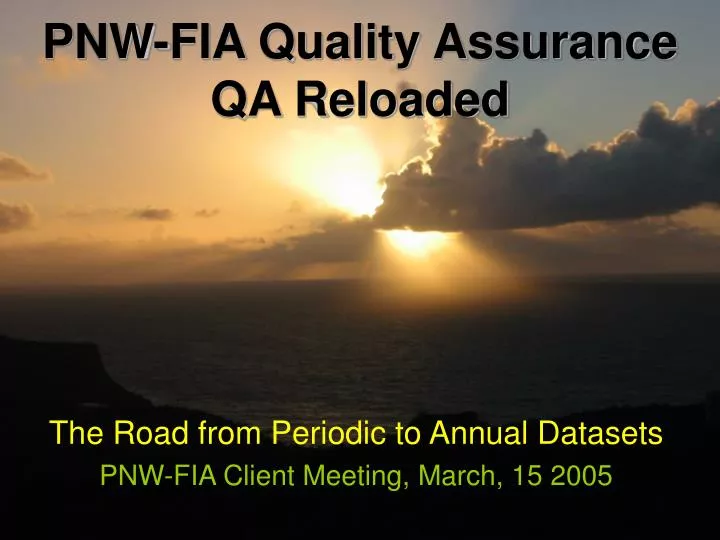
PNW-FIA Quality AssuranceQA Reloaded The Road from Periodic to Annual Datasets PNW-FIA Client Meeting, March, 15 2005
QA Definitions QA is: • A light and bouncy subject engaging staff at all levels with incentives to get the job done right the second time. Or:
QA Definitions • A process to produce research data and results with known precision, completeness, representativeness, comparability, and, where appropriate accuracy. • Encompasses the planning, design, implementation, analysis, and reporting to meets the users’ requirements for data quality.
The Questions: • How do we assure that the new annual system of data collection, compilation, and summary accurately portray the status and changes in forest resources? • How do we calibrate annual with periodic inventory?
The Challenge: • When definitions, sampling design, and compilation methods have simultaneously changed, how do we tease out resource changes?
Background – Inventory Transition • Periodic to annual plot design changes. • Plot selection on new grid. • Definitions changed; e.g.: • Reserved status refined, woodland cover/stocking, trees, forest type grouping. • Compilation routine changed (NIMS). • Stockability adjustments in transition. • Disparate systems to uniform system.
Plot Footprint Overlay Periodic Annual
Background – Inventory Transition • Periodic to annual plot design changes. • Plot selection on new grid. • Definitions changed (e.g.: • Reserved status refined, woodland cover/stocking), trees, forest type grouping. • Compilation routine changed (NIMS). • Stockability adjustments in transition. • Disparate systems to uniform system.
The Overall QA Approach: • Compare periodic IDB estimates with average of state panels • Dissect definition changes • Dissect compilation changes
The Approach - Two Phases: 1. Short term data reconciliation. • a. Spot check critical algorithms. • b. Account for critical definition changes. • c. Begin documentation of compilation.
The Approach: 2. Thorough checking & documentation. • a. Account for all error checks & develop checks where missing. • b. Thorough documentation: • Field methods. • Compilation algorithms and programs. • c. Review and reconciliation of products.
Phase I (Data reconciliation)High-Priority Tasks: • Comparison and tracking differences between NIMS and IDB compilation. Done at the “code level” to understand how things get expanded out. • Data flow diagram and description - start with current problem areas - including better documentation, PLSQL to English. • Trace back of variable derivation and error checking (key variables initially).
Variable Traceback Examples
Variable Tracebacks EXPANDALL Definition: These are the expansion acres for a plot, unadjusted for unmeasured conditions. Derivation: EXPANDALL = AREATOT_EU divided by P2POINTCNT from the AREA stratification (EVALID = 26, 28, or 30). Other pertinent info: This variable is only used in 1 of the INDY tables, to show estimates for the area of: estimated census water denied access land hazardous land.
Site class documentation (just the short term needs for now). • Stocking adjustments - Identify new eco-zones and how to assign to plots – Stockability. • ID and compare stratification used in NIMS and IDB. • QA NIMS outputs – procedures and document. • Develop change tracking tools for NIMS.
QA Intermission… Question: How many QA staffers do you need to screw in a light bulb? Answer: 217, with a standard error of 219.
QA Intermission… The Interpretation: On the bright side, you've just doubled your QA staff; (217 +219 = 436)!
QA Intermission… The Interpretation: On the dark side, you've just hired two Microsoft QA technicians; (217 – 219 = client testing)
Ability to share NIMS on fast server (everyone using the same data). • Review changes in definitions between periodic and annual (for key variables only). • Develop test data-set to review program outputs. • Get or develop NIMS user guide. • Spatial location documentation – QA and explain how points are selected.
Document how we determine whether plot is forested or non-forested (plot selection periodic vs. annual). • Evaluate change in landclass calls on a plot by plot basis (periodic vs. annual). • Coordination with NIMS national programmers. More than reporting errors? • Develop alternate plan to recompile prior inventories.
Phase II – The Ongoing Process Rebuilding the QA system • Definitions & crosswalk documentation. • Corporate QA filing structure. • Near real time plot status by state. • Data load documentation. • Data load checks & edits documented. • Graphical checks for outliers and flagging missing data.
Phase II – The Ongoing Process Rebuilding the QA system • Dataflow documentation. • Data version tracking and documentation. • Compilation program documentation (English). • Algorithm documentation with sources. • Step by step checklists. • Explicit procedures for tracking review of products.
Importance of QA In 1990, world stats showed forest land in country X had declined by half from 1980 to 1990. Ministers ready to disband the forestry division. Money poured in to the country to stop deforestation. Inventory system was completely revamped. After inventory, it was learned that country X had misclassified nonforest land as forestland 1980.
Oops. • Everyone makes mistakes. • Get procedures in place to check and document everything you do.