Download

1 / 32
340 likes | 546 Views
Using Multilevel Modeling to Analyze Longitudinal Data. Mark A. Ferro, PhD Offord Centre for Child Studies Lunch & Learn Seminar Series January 22, 2013. Recommended Readings.

E N D
Using Multilevel Modeling to Analyze Longitudinal Data Mark A. Ferro, PhD Offord Centre for Child Studies Lunch & Learn Seminar Series January 22, 2013
Recommended Readings • Singer JD, Willett JB. Applied longitudinal data analysis. Modeling change and event occurrence. New York: Oxford University Press; 2003. • Singer JD. Fitting individual growth models using SAS PROC MIXED. In: Moskowitz DS, Hershberger SL, editors. Modeling intraindividual variability with repeated measures data. Methods and applications. Mahwah: Lawrence Erlbaum Associates; 2002. • Singer JD. Using SAS PROC MIXED to fit multilevel models, hierarchical models, and individual growth models. J EducBehav Stat 1998;24: 323-55.
Objectives • Explore longitudinal data • Wrong approaches • Understand multilevel model for change • Specify the level-1 and level-2 models • Interpret estimated fixed effects and variance components • Data analysis with the multilevel model • Adding level-2 predictors • Comparing models
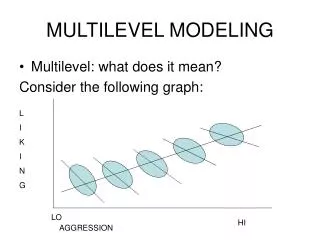
Research Questions • Broadly speaking, we are interested in two types of questions: • Start by asking about systematic change over time for each individual • Next ask questions about variability in patterns of change over time (what factors may help us explain different patterns of growth?)
Wrong Approaches • Estimated correlation coefficients: • Problem: only measures status, not change (tells whether rank order is similar at both time-points) • Use difference score to measure change and use this as an estimate of rate of change • Problem: assumes linear growth over time, but change may be non-linear
Less-than-Ideal Approaches • Aggregate data • Reduced power • No intra-individual variation • Repeated Measures ANOVA • Reduced power • Equal linear change • Compound symmetry Level 2 Level 1 Level 2 Level 1 0 1 2 0 2 8
Advantages of MLM • Flexibility in research design • Different data collection schedules • Varying number of waves • Identify temporal patterns in the data • Inclusion of time-varying predictors • Interactions with time • Effects that get smaller or larger over time
Example Dataset • Longitudinal Study of American Youth (LSAY) • N=1322 Caucasian and African-American students • Change in mathematics achievement between grades 7-11 • At what rate does mathematics achievement increase over time? • Is the rate of increase related to student race, controlling for the effects of SES and gender?
How to Answer the Questions? • Exploratory analysis • Fit taxonomy of progressively more complex models • Unconditional means model (not shown) • Unconditional linear growth model • Add race as level-2 predictor of initial status and rate of change in match achievement • Add SES as level-2 control variable, testing impact on initial status and rate (does effect of race change?) • Add gender as level-2 control variable,… • Select final model and plot prototypical trajectories • Residual analysis to evaluate tenability of assumptions
Multilevel Model for Change • Level-1 model: • Level-2 model: • Composite model: structural stochastic
Level-1 Model • Within-individual • Intercept of individual i’s trajectory (initial status) • Centred at a time 0 • Math achievement at time 0 • Slope of individual i’s trajectory (rate of change) • Change in math achievement between each time point • Deviations of individual i’s trajectory from linearity on occasion j (error term) • ~N(0,σ2)
Level-2 Model • Between-individual • Population average intercept and slope for math achievement for reference group (Caucasian) • Difference in population average intercept and slope for math achievement between African-American and Caucasian • Difference between population average and individual i’s intercept and slope for math achievement, controlling for race
Level-2 Model Residuals • Variance-covariance matrix • Population variance in intercept, controlling for race • Population variance in slope, controlling for race • Population covariance between intercept and slope, controlling for race
SAS Syntax procmixeddata=lsaynoclprintnoinfocovtestmethod=ml; title'Model A: Unconditional Linear Growth Model'; classlsayid; model math = grade_c / solutionddfm=bwnotest; randominterceptgrade_c /subject=lsayidtype=un; run;
Unconditional Linear Growth – Fixed Effects t-test for null H0 of no average change in achievement in the population Estimated yearly rate of change in math achievement Estimated math achievement in 7th grade
Unconditional Linear Growth – Random Effects Estimated variance in intercept Estimated covariance between intercept and slope Estimated variance in level-1 residuals Estimated variance in slope
SAS Syntax procmixeddata=lsaynoclprintnoinfocovtestmethod=ml; title'Model B: Adding the Effect of Race'; classlsayid; model math = grade_caaaa*grade_c/ solutionddfm=bwnotest; randominterceptgrade_c /subject=lsayidtype=un; run;
Adding the Effect of Race – Fixed Effects Estimated yearly rate of change in math achievement for Caucasians Estimated math achievement in 7th grade for Caucasians Estimated difference in yearly rate of change in math achievement between Caucasian and AA Estimated difference in math achievement in 7th grade between Caucasians and AA
Adding the Effects of Race – Random Effects Estimated variance in intercept, controlling for race Estimated covariance between intercept and slope, controlling for race Estimated variance in level-1 residuals Estimated variance in slope, controlling for race
SAS Syntax procmixeddata=lsaynoclprintnoinfocovtestmethod=ml; title'Model B: Adding the Effect of Race'; classlsayid; model math = grade_caaaa*grade_csesses*grade_c/ solutionddfm=bwnotest; randominterceptgrade_c /subject=lsayidtype=un; run;
Adding the Effects of SES – Fixed Effects Estimated yearly rate of change in math achievement for Caucasians of average SES Estimated math achievement in 7th grade for Caucasians of average SES Estimated difference in yearly rate of change in math achievement between Caucasian and AA, controlling for SES Estimated difference in math achievement in 7th grade between Caucasians and AA, controlling for SES Estimated effect of SES on average 7th grade achievement, controlling for race Estimated effect of SES on rate of change of achievement, controlling for race
Adding the Effects of SES – Random Effects Estimated variance in intercept, controlling for race and SES Estimated covariance between intercept and slope, controlling for race and SES Estimated variance in level-1 residuals Estimated variance in slope, controlling for race and SES
SAS Syntax procmixeddata=lsaynoclprintnoinfocovtestmethod=ml; title'Model B: Adding the Effect of Race'; classlsayid; model math = grade_caaaa*grade_csesses*grade_c/ solutionddfm=bwnotest; randominterceptgrade_c /subject=lsayidtype=un; run;
SAS Syntax procmixeddata=lsaynoclprintnoinfocovtestmethod=ml; title'Model B: Adding the Effect of Race'; classlsayid; model math = grade_caasesses*grade_c female / solutionddfm=bwnotest; randominterceptgrade_c /subject=lsayidtype=un; run;
Goodness-of-Fit • Deviance • -2LL statistic • Worse fit = larger -2LL • Can be compared in nested models • χ2 distribution, df = difference in number of parameters • AIC & BIC • Can be used for non-nested models • AIC corrects for number of parameters estimated • BIC corrects for sample size and number of parameters, so larger improvement needed for larger samples
Presenting Results Ferro & Boyle. Journal of Pediatric Psychology 2013;38(4):425-37
Plotting Trajectories for Prototypical Individuals Estimates of initial status and rate of change for Caucasian and African-American girls of high and low SES
Assumptions & Evaluation Assumption Evaluation Examine empirical growth plots for evidence of linearity Plot OLS estimates of growth parameters vs. each predictor Standard diagnostics for level-1 and level-2 • Level-1 growth model is linear • Level-2, relationship between predictors and intercept and slope is linear • Level-1 and level-2 residuals are normal and homoscedastic