Download
1 / 31
310 likes | 430 Views
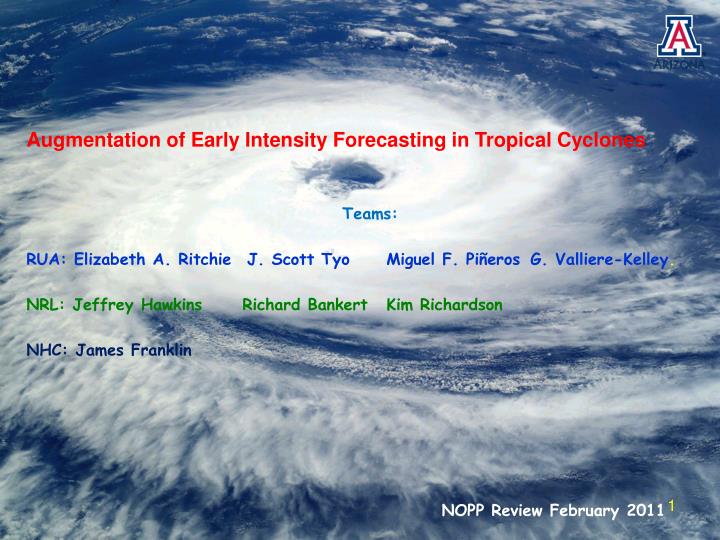
Augmentation of Early Intensity Forecasting in Tropical Cyclones Teams: RUA: Elizabeth A. Ritchie J. Scott Tyo Miguel F. Piñeros G. Valliere-Kelley . NRL: Jeffrey Hawkins Richard Bankert Kim Richardson NHC: James Franklin. NOPP Review February 2011 . Overview. Introduction and Motivation

E N D
Augmentation of Early Intensity Forecasting in Tropical Cyclones • Teams: • RUA: Elizabeth A. RitchieJ. Scott TyoMiguel F. Piñeros G. Valliere-Kelley. • NRL: Jeffrey Hawkins Richard Bankert Kim Richardson • NHC: James Franklin NOPP Review February 2011
Overview Introduction and Motivation Data Methodology Intensity Estimation Mitigation of issues/problems Other work to be done
30 N 20 N 10 N 90 W 75 W 60 W 45 W 1. Motivation Question: Can we characterize the axisymmetry (or lack thereof) of these cloud clusters and relate that to their stage of development/intensity? Can we do this at low intensities?
2. Data Eastern North Pacific: Infrared Imagery (GOES-W) Atlantic and Gulf of Mexico: Infrared Imagery (GOES-E) • 2005-2006 • Spatial resolution: 5 km/pixel • Temporal resolution: 30 min • 10.7 μm • 2004-2010 • Spatial resolution: 5 km/pixel • Temporal resolution: 30 min • 10.7 μm Will focus on this basin in this presentation Western North Pacific: Infrared Imagery (MTSAT) • 2007- … • Spatial resolution: 5 km/pixel • Temporal resolution: 30 min • 10.7 μm
3. Methodology Artificial Vortex Gradient Detail IR Image Gradient Detail
Deviation Angle Calculation. If we choose some “reference pixel” in the IR image and make that the centre of a 350-km radius circle, then we can draw radials from that “center” to every pixel within the circle. The deviation angle is the angle between the gradient vector angle at a particular pixel and the radial from the center pixel. The difference angles for every pixel within the circle are accumulated into a histogram and the variance is calculated.
Departure Angle Variance 09/18/2005 08:15 UTC 25kt 09/19/2005 14:15 UTC 55 kt 09/21/2005 14:15 UTC 130 kt Hurricane Rita (2005)
Choosing a reference point in a real cloud system How do we choose the perfect center pixel? Especially at early times when even the experts find it tough? Aug 24 00:15 UTC 30 kt Aug 24 21:15 UTC 45 kt Aug 28 00:15 UTC 100 kt Hurricane Katrina (2005) Center Location?
Choosing a reference point in a real cloud system The short answer is “we don’t”!!
(a) (b) (d) (c) Departure Angle Variance Calculate the variance using each pixel as the reference center, in turn. Then, • Best Center? • Best Radius? map the variance back to the pixel that was the reference center, creating a “map of variances” that corresponds to the original IR image. Center finder?
Departure Angle Variance (DAV) 25kt 35kt 130kt Hurricane Wilma (2005) Extract the minimum value
Intensity DAV Time Series Intensity Variance Unfiltered Variance Filtered Hurricane Rita (2005)
2D Histogram: DAV – Intensity • For the Atlantic:- • All DAV time series from the training set (2004-2008) are mapped to the (NHC) best-track intensity • Because of the oscillations in the filtered DAV signal, several values can map to a single best-track intensity value (the best track is 6-h and 5-kt resolution). • The median of all the DAV values that map to a single best track intensity estimate is used to create the following data scatter plot
2D Histogram: DAV – Intensity 20 deg2 x 5 kt bins
Diurnal Oscillation Example: Hurricane Jeanne (2004) 2D Histogram: DAV – Intensity Red dots: Jeanne’s values
4. Results of testing Two tests: 1. Randomly remove 30% of 2004-2009 cases for testing Train with 70% cases Estimate intensity with remaining 30% 2. Train using 2004-2008 cases. Test with 2009
4. Results of testing Training: 70% of 2004-2009 Testing: 30% of 2004-2009, RMSE: 14.7kt
Root Mean Square Error Training: 2004-2008 Testing: 2009, RMSE: 24.8kt What Happened ??? It turns out that if we remove these two cases from the set, the RMSE drops to …
Root Mean Square Error Training: 2004-2008 Testing: 2009, RMSE: 12.9kt That is, most of the error is contained in these two cases … What’s so special about them?
Wind Speed Estimation – 2009 bad cases Tropical Storm Erika 0615 UTC September 1 ** Tropical Storm Ana 0615 UTC August 12 30 kt These storms are very weak, sheared, with a very circular, but offset cloud signature. The DAV is “designed” to calculate a low variance for these types of clouds → low variance = high intensity! and the system overestimated these two storms by a lot!!
5. Mitigation of bad cases and other issues Inter-annual and Intra-seasonal Variability:- One possible issue that comes to mind (for automated statistical systems like this) is that when a particular year tests much higher than the random sample testing it might mean that there are inter-annual or intra-seasonal variations for an individual year that are not well captured in the training set (e.g., no prior years with this type of sheared case). To check this, we fitted sigmoids to individual years, and then to individual months over the 5-y (2004-2008) period and simply looked at how they varied … here we show the year-to-year.
Inter-annual and Intra-seasonal Variability These are the curves for individual years. The 5-year fit is the black line that runs smack in the middle of the pack. You can see that there is little variation from year-to-year in these curves.
Inter-annual and Intra-seasonal Variability In other words, it seems unlikely that inter-annual and intra-seasonal variations exist in the DAV signal. We look elsewhere for solutions to the “shear” problem.
Wind Speed Estimation – 2009 bad cases An option to “fix” this kind of problem (when the real center of circulation is exposed and away from the cloud center of mass): Use the “operational center fix” as the center pixel for the DAV calculation and only calculate the DAV within a small area of that center.
Use “best track centers” Training on 2004-2009 and Testing on 2010 using the NHC “best track center” to locate the DAV values: RMSE: 13.04 kt. Still re-calculating for 2009 test to see if this improves the two sheared cases of Ana and Erika. At least it hasn’t made things worse!!
6. What about the other basins?? • Eastern North Pacific (2005-2010): • Processed 2005 and 2006 (before pulling personnel to program the “best track center” algorithm) • Western North Pacific (2007-2010): • located MTSAT imagery (@ NRL collaborators) • working on the best strategy for processing these data • new strategy: pre-processing of imagery done locally at NRL, sectored, and mapped images are downloaded to UA for training.
6. What about the low wind speeds?? • At low wind speeds the ground truth for best track intensity estimates is rather lacking since these systems tend to form far out in the eastern Atlantic (in the Atlantic basin case). • Also, there are far fewer best track estimates for these low winds than, say, 35-60 kt range.
What about the low wind speeds?? • This means that the spread in DAV to best track estimates for the low wind speeds is much higher, giving low confidence in the validity of the parametric DAV-intensity curve at these low wind speeds. • Two methodologies we are pursuing to mitigate this problem: • 1. run a **thousand** realizations of real cases using a high-resolution mesoscale model from which we can build our own “best track intensity” database and match it to simulated DAV values. This has the advantage that we will obtain 30-min intensity estimates to match the 30-min DAV calculations – already started on 2010 cases. • 2. use the subset of observations where there are aircraft reconnaissance intensities at the low wind speeds to build the relationship. Will there be enough for the parametric curve to be robust? We will see!
7. Summary • A completely objective technique that characterizes the structure of a cloud system in terms of its departure from axisymmetry • Correlates very well with intensity • Created a set of parametric relationships between the DAV and intensity based on 2004-2008/2009 training set • Testing with independent datasets • best result: RMSE = 14.7 kt for random TCS from 2004-2008 • 2009 result: RMSE = 24.8 kt for 8 cases • RMSE = 12.9 kt for 6 cases (sans Ana and Erika) • Using NHC best track centers: 2010 result: 13.04 kt
Future Work • Working on other two basins. • Have two ideas to use on getting the low wind speed estimates • Also (suggested by J. Hawkins) to bin by cloud scene types and score the estimator based on those to give confidence values on the intensity estimate (potential input to SATCON) • Easier tasks: test sensitivity to image resolution (5 vs 10 km) • Test using different filter on DAV signal
Thank you Piñeros, M. F., E. A. Ritchie, and J. S. Tyo 2008: Objective measures of tropical cyclone structure and intensity change from remotely-sensed infrared image data. IEEE Trans. Geosciences and remote sensing.46, 3574-3580. Piñeros, M. F., E. A. Ritchie, and J. S. Tyo 2010: Detecting tropical cyclone genesis from remotely-sensed infrared image data. IEEE Trans. Geosciences and Remote SensingLetters, 7, 826-830. Piñeros, M. F., E. A. Ritchie, and J. S. Tyo 2011: Estimating tropical cyclone intensity from infrared image data. Wea. Forecasting, (In review)