Download
1 / 22
220 likes | 337 Views
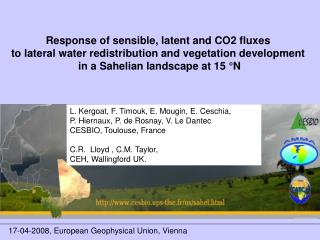
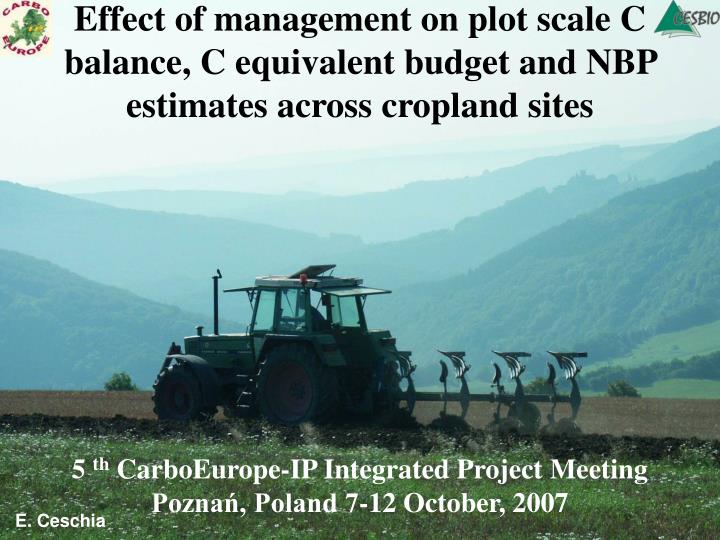
Effect of management on plot scale C balance, C equivalent budget and NBP estimates across cropland sites. 5 th CarboEurope-IP Integrated Project Meeting Poznań, Poland 7-12 October, 2007. E. Ceschia. Main objectives.

E N D
Effect of management on plot scale C balance, C equivalent budget and NBP estimates across cropland sites 5 th CarboEurope-IP Integrated Project MeetingPoznań, Poland 7-12 October, 2007 E. Ceschia
Main objectives • To calculate and compare annual C budgets including C importations/exportations (NBP) for each site/crop type/crop rotation • To estimate CO2 and other GHG emissions caused by each management task • To calculate annual C Equivalent Budgets (CEB) for each site/crop type/crop rotation. • To analyse the effect of management practices on NBP and CEB
Some questions • Are they systematic trends in terms of NBP and CEB for a specific crop across Europe ? • How do C exportation and management influence NBP and CEB ? • Can we identify management practices to encourage in order to reduces GHG emissions and increase soil C stocks ? • Can we link trends in NBP with changes in soil C stocks ? (maybe too early to answer that)
Auradé (Gers, 32) Auradé and Lamasquère Lamasquère (Haute Garonne,31) • Same setup (Open path…) • Both sites are part of CERES • Only 12 km between the two sites but • soil&management are very different
Auradé Surface area : 23.5 ha Located on gentle slope (3%) Historic : Cultivated for more than 50 years Rotation : wheat-sunflower-wheat-rapeseed Management : tilled, fertilised (mineral), no control on management Lamasquère Surface area : 32.3 ha Located in a flat large alluvial valley Historic :Cultivated for more than 30 years Rotation : triticale-maize-sunflower-maize Management : tilled, (irrigated) and fertilised (organic + mineral), no control on management yet Plots differ in terms of management
Management effect on GPP and Ecosystem Respiration Crop regrowth Tillage Rapeseed Winter wheat Winter wheat Triticale Maize
Influence of crop management on Cumulated NEE Crop regrowth Crop regrowth Rapeseed Crop regrowth Non_invertion tillage + seeding Triticale Maize Harvest Winter wheat Ploughing (30 cm) Cover crop Harvest Winter wheat Rotative hoe Ploughing (30 cm)
Comparing C fluxes and C exported Most of the biomass is exported at Lamasquère for animal farming
Methodology to asses management effects on carbon equivalent budget • Each operation was identified with the farmers • Associated emissions (next slide) were calculated and converted in C equivalent. • Carbon Equivalent Budget (CEB) was calculated considering NEE measured by eddy covariance, C exports, all GHG emissions listed below and carbon inputs through organic fertilisation. : CEB = NEE + emissions + organic inputs + C exports
Calculation of the Emissions Direct emissions : • fuel burned for tractorised equipment • Irrigation rough estimate (Follett, 2001) Indirect emissions: • Production, formulation, storage, distribution, packaging of all chemicals including fertilisers • Manufacture and maintenance of the machines • N2O and CH4 emissions caused by fertilisation (organic + mineral) Conversion factorsfrom ADEME report 2005, IPCC, Lal 1997, 2004
We considered the carbon exported as biomass from the plot returns directly to the atmosphere, otherwise…
CEB from October to October * * * From March to october CEB: - For Winter wheat : -23 Kg eqC ha-1 - For Maize : 5187 Kg eqC ha-1
CESBIO and ADEME comparison Winter wheat maïze ADEME = energy management and sustainable developpement institute
What I need from you… • Help me to improve conversion factors : from recent studies, national inventories, your experience…(ex : N2O emissions/fertiliser type) • List all the managment task that can induce GHG emissions (fill in the CarboEurope database) : might not be enough…
Optimistic Agenda ? • You can start now to fill in the database and feed me with optimised conversion factors • Identification of potential missing information in the database in December/January • Data collection in February-March • Analysis in spring • Writing in summer • Interaction with you in autumn • Submission in late 2008
Emissions caused by manufacturing and use of the machines • Interview with farmers to estimate the average length of each management task. • Fuel consumption of the machine depending on the task (ploughing, fertilising…) or hourly emission factors depending on management task and crop type. • We considered that 1l of domestic fuel = 0,814 kg EC • ADEME report used to calculate emission factors for manufacture and amortization of the machines
Emissions caused by manufacture of the chemicals • Identification of the active substance • Conversion in EC using a conversion table (G.Gaillard, P.Crettaz, J. Heusheer, 1997. Inventaire environnemental des intrants agricoles en production végétale. Comptes rendus de la FAT). • When active substance is not identified/referenced we assumed conversion factors of 2 kg EC/kg SA +/- 50% for herbicides and 1,7 kg EC/kg SA +/- 50% for fongicides. • Note: those conversion factors include manufacture, packaging and transportation
Emissions caused by organic and mineral fertilisers • Emissions for manufacture (mineral) and producing organic fertiliser : the amount of fertiliser applied is converted in EC emissions using conversion factors from G.Gaillard, et al. (1997). • N2O emissions caused by mineral fertiliser application : we considered that 1,77% of the fertiliser amount applied was tranformed in N2O and 1 kg N2O = 80,7kg EC • Uncertainty for conversion factors of 30% or more ?
Exemple d’émission globale liée à l’application d’engrais pour Lamasquère 2004-2005: