Download
1 / 18
180 likes | 339 Views
Mapping the sub-oval proton auroras into the magnetosphere. A. G. Yahnin and T. A. Yahnina Polar Geophysical Institute, Apatity, Russia. Plasma Physics in the Solar System, SRI, Moscow, 6-10 February 2012. proton H . Lyman photon. N 2. collision charge exchange. velocity.

E N D
Mapping the sub-oval proton auroras into the magnetosphere A. G. Yahnin and T. A. Yahnina Polar Geophysical Institute, Apatity, Russia Plasma Physics in the Solar System, SRI, Moscow, 6-10 February 2012
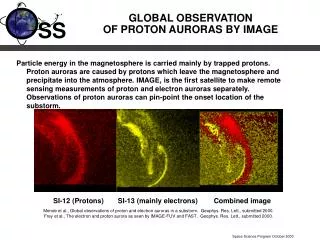
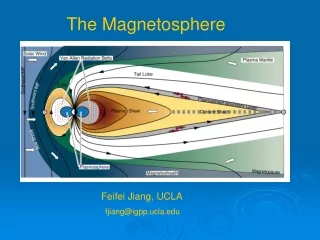
proton H Lyman photon N2 collision charge exchange velocity excited neutral H emission H atom Proton aurora from the IMAGE spacecraft The FUV SI12 instrument onboard the IMAGE spacecraft was capable to observe the “proton aurora” - the luminosity in the Doppler shifted Lyman Hα line at 121.82 nm. This emission is produced by precipitation of magnetospheric protons after charge exchange with atmospheric constituents. The Doppler shift is due to motion of the emitting neutral hydrogen. Courtesy of S. Mende
Proton aurora from the IMAGE spacecraft Dayside sub-oval proton flashes Hubert et al., GRL, 2003 Zhang et al., JGR, 2003 Fuselier et al., JGR, 2004 Sub-oval proton spots Frey et al., JGR, 2004 Sub-oval proton arcs Immel et al., GRL, 2002 Burch et al., JGR, 2002 Spasojevic et al., JGR, 2004 After H. Frey, Rev. Geophys., 2007
Relationship between sub-oval proton aurora and EMIC/Pc1 waves Day-side sub-oval proton flashes Yahnina et al., JGR, 2008 Popova et al., GA, 2010 Zhang et al., JGR, 2008 Sub-oval proton spots Yahnin et al., JGR, 2007 Yahnina & Yahnin, GA, 2012 Sub-oval proton arcs Immel et al., GM, 2005 Yahnin et al., JGR, 2009 Spasojevic et al., GM, 2005 Yuan et al., GRL, 2010
Relationship between sub-oval proton aurora and EMIC/Pc1 waves Day-side sub-oval proton flashes Pc1 bursts or Pc1 Sub-oval proton spots “Monochromatic” Pc1 Sub-oval proton arcs IPDP or Pc1
Mapping the sub-oval proton aurora relatively to plasmapause Mapping into the magnetosphere is, in particular, important for understanding what is (are) the main parameter(s) controlling the regime of the IC instability development (hot proton anisotropy, hot proton density, and cold plasma density) in different conditions. As to cold plasma, direct comparisons of sub-oval aurora with plasmasphere are very scanty in spite of the IMAGE spacecraft carried a special instrument (EUV imager) to observe the cold plasma distribution.
Mapping the sub-oval proton aurora relatively to plasmapause We used the plasmapause model by V. Pierrard from Belgian Institute for Space Aeronomy; this model is available at http://www.spaceweather.eu. In this model the plasmapause is suggested to form due to Lemaire’s physical mechanism based on interchange instability (e.g., Lemaire and Gringauz, 1998).
Mapping the sub-oval proton aurora relatively to plasmapause Pierrard & Lemaire, GRL, 2004 Pierrard & Cabrera, Ann. Geophys., 2005 Pierrard et al., JGR, 2007 Pierrard & Stegen, JGR, 2008 Numerical calculations based on the Lemaire’s theory and a Kp-dependent magnetosphericelectric field model satisfactorily reproduce plasmapause observed with IMAGE EUV.
Event of 2Sep 2004 1 Sept 2 Sept 3 Sept 11 of 13 considered events demonstrate that proton spots map into the vicinity of plasmapause (L<0.5 RE). This is one of “good” examples.
Event of 25 June 2003 24 Jun 25 Jun 26 Jun 11 of 13 considered events demonstrate that proton spots map into the vicinity of plasmapause (L<0.5 RE). This is one of “good” examples.
Event of 17July 2004 16 Jul 17 Jul 18 Jul 11 of 13 considered events demonstrate that proton spots map into the vicinity of plasmapause (L<0.5 RE). This is one of “good” examples.
Event of 3Aug 2003 FUV 2 Aug 3 Aug 4 Aug 11 of 13 considered events demonstrate that proton spots map into the vicinity of plasmapause (L<0.5 RE). This is one of “good” examples.
Event of 26Nov 2001 FUV EUV 25 Nov 26 Nov 27 Nov Frey et al., 2004 “Bad” example: The spot maps well inside modeled plasmapause. However, EUV data show clear structure of the outer plasmasphere. Thus, location of the spot projection in this case is also consistent with the cold plasma gradient.
Event of 28Feb 2001 27 Feb 28 Feb 29 Feb “Bad” example: The spot maps well outside modeled plasmapause.
Conclusion • Mapping of the proton aurora spots onto the equatorial plane shows that the source of the quasi-monochromaticEMIC emissions (Pc1)tends to occur at the cold plasma gradients. • This agrees with the theoretical prediction that both low and very high values of the cold plasma density reduce the increment of the ion-cyclotron instability. • Observations of proton aurora spots can be used as an indicator of the plasmapause location.
Night-to-morning side sub-oval proton aurora arc (Poster #96) IMAGE 10 November 00:50 UT 50 70 18 NOAA-16 00
Night-side sub-oval proton aurora arc, LPEP and plasmapause 70 60