Download
1 / 3
30 likes | 111 Views
L2. L2. L1. L1. dilution. SYPRO. Coomassie. neat. 1:2. 1:4. 1:8.

E N D
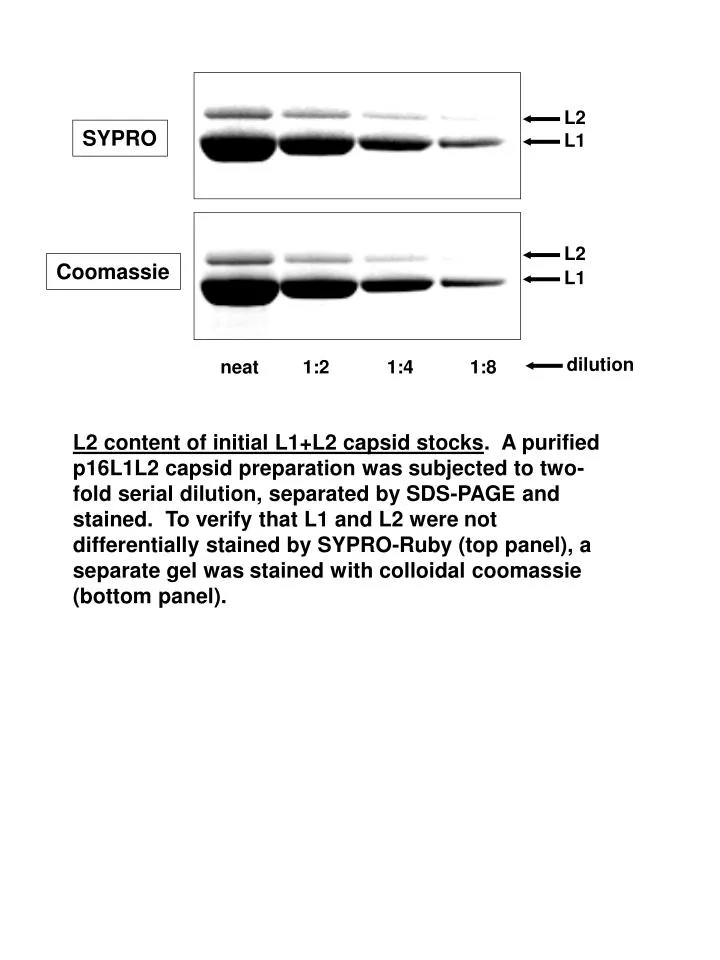
L2 L2 L1 L1 dilution SYPRO Coomassie neat 1:2 1:4 1:8 L2 content of initial L1+L2 capsid stocks. A purified p16L1L2 capsid preparation was subjected to two-fold serial dilution, separated by SDS-PAGE and stained. To verify that L1 and L2 were not differentially stained by SYPRO-Ruby (top panel), a separate gel was stained with colloidal coomassie (bottom panel).
Raw cryo-EM micrographs. Electron microscope images of HPV16 L1-only capsids (a), capsids with a 10:1 ratio of L1:L2 (b), or L1+L2 capsids with a 6:1 ratio of L1:L2 (c) in vitrified ice. Bar = 200 Å.
* Reconstruction of capsids with an average of 36 molecules of L2. Computerized reconstructions of L1-only (a,b,c) and L1+L2 capsids (e,f,g) with an average of 36 molecules of L2 per capsid are shown in various views. The far left images are of the central section through vertex (pentavalent) capsomers. An area of additional density present in L1+L2 capsids is marked with a red asterisk. Three-dimensional reconstructions (3DR) show exterior and cutaway / interior views of each type of capsid. DNA and histone density have been computationally removed from the interior view (b,c,d,f,g,h). The far right images represent 3DR of the difference image (L1+L2 minus L1-only capsids) in red. The top right panel (d) shows L2-specific density (red) superimposed on an interior view of the L1-only 3DR (blue), while the bottom right panel (h) shows only the L2-specific density (red). Bar = 200Å.