Download
1 / 30
300 likes | 458 Views
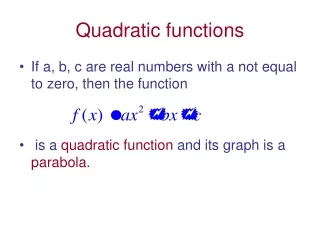
Section 2.2 Quadratic Functions. Graphs of Quadratic Functions. Graphs of Quadratic Functions Parabolas. Vertex. Minimum. Maximum. Axis of symmetry. Graphing Quadratic Functions in Standard Form. Seeing the Transformations. Using Standard Form.

E N D
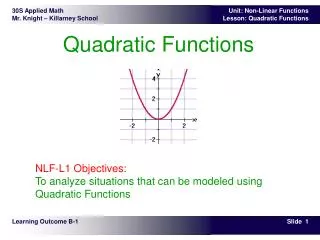
Graphs of Quadratic Functions Parabolas Vertex Minimum Maximum Axis of symmetry
Using Standard Form a<0 so parabola has a minimum, opens down
Example Graph the quadratic function f(x) = - (x+2)2 + 4.
Example Graph the quadratic function f(x) = (x-3)2 - 4
Using the form f(x)=ax2+bx+c a>0 so parabola has a minimum, opens up
Example Find the vertex of the function f(x)=-x2-3x+7
Example Graph the function f(x)= - x2 - 3x + 7. Use the graph to identify the domain and range.
Example For the function f(x)= - 3x2 + 2x - 5 Without graphing determine whether it has a minimum or maximum and find it. Identify the function’s domain and range.
Graphing Calculator – Finding the Minimum or Maximum Input the equation into Y= Go to 2nd Trace to get Calculate. Choose #4 for Maximum or #3 for Minimum. Move your cursor to the left (left bound) of the relative minimum or maximum point that you want to know the vertex for. Press Enter. Then move your cursor to the other side of the vertex – the right side of the vertex when it asks for the right bound. Press Enter. When it asks to guess, you can or simply press Enter. The next screen will show you the coordinates of the maximum or minimum.
Quadratic Regression on the Graphing Calculator More on the next slide.
Quadratic Regression on the Graphing Calculator To see the scatter plot of these data points press 2nd Y= to get STAT PLOT. Press ENTER on #1. If Plot 2-3 are ON, then change those to OFF. You can turn all plots off by pressing #4. Then return to this screen and press #1 to turn this plot on. This is the Plot1 Screen. Press ENTER on the word On. Cursor down and choose the style of graph that you want. The first is a scatterplot. The XList should be L1, and YList L2. Choose one of the marks for your graph. For L1 or L2 press 2nd 1 or 2nd 2. By pressing GRAPH you will get the graph that you see at left.
Example You have 64 yards of fencing to enclose a rectangular region. Find the dimensions of the rectangle that maximize the enclosed area. What is the maximum area?
Graphing Calculator Problem continued on the next slide
(a) (b) (c) (d)
(a) (b) (c) (d)