Download
1 / 51
510 likes | 609 Views
Pedagogical Objectives Bioinformatics/Neuroinformatics Unit. Review of genetics Review/introduction of statistical analyses and concepts Introduce QTL analysis Introduce bioinformatic tools Review/introduction of molecular techniques. So, now the gametes of the F 1 have some of

E N D
Pedagogical ObjectivesBioinformatics/Neuroinformatics Unit • Review of genetics • Review/introduction of statistical analyses and concepts • Introduce QTL analysis • Introduce bioinformatic tools • Review/introduction of molecular techniques
So, now the gametes of the F1 have some of the DNA from each F0 strain. So, the F2 generation will have a collage of the F0 DNA
Hey! We have at Least three maps! Chromosomal, linkage, physical. Linkage map is in centimorgans.
This is a PCR product for a marker— or Locus (remember Quantitative Trait Loci?) it is a small stretch of DNA that is different between the two different strains. A marker can be in any aspect of the DNA: gene, promoter, expressed sequence, intron, “junk,” etc., etc..
Qualitative vs Quantitative Traits Qualitative Traits Influenced by a single gene Typically follow simple patterns of inheritance Phenotypes fall into distinct categories (nominal scale) Trait expression is typically unaffected by environment Quantitative Traits Influenced by multiple genes, perhaps interacting genes Do not follow simple patterns of inheritance Phenotype is measured on continuous scale (interval scale) Trait expression may be affected by environment
Pedagogical ObjectivesBioinformatics/Neuroinformatics Unit Review of genetics Review/introduction of statistical analyses and concepts Introduce QTL analysis Introduce bioinformatic tools Review/introduction of molecular techniques
What is key in using regression to control for various extraneous variables is the additive model of variance. s2total=s2sex+s2bodyweight + s2brainweight+ s2age +s2error + s2olfactorybulb genes
Thus, the total variance can be partitioned into the variance associated with each of these extraneous variables such as sex, body weight, brain weight, and age. Then we can successively remove the variance associated with each of these variables and hopefully just have residual variance that only pertains to olfactory bulbs.
Let us first consider the case of simple linear regression before we tackle the problem of multiple regression.
Residual (error) _ ^ Y OB Volume Y Variance predicted by X Body Weight (grams)
The variance left over after the variance from the other variable(s) has been removed is the residual variance. This residual variance is precious to us because it has the variance specific to gene effects on olfactory bulbs.
So the SSE SSyy is our treasure, yet another’s trash.
By using multiple regression, We can remove the variance associated with extraneous variables and so statistically control for these variables.
How to make mistakes with statistics Type II (beta) errors—AKA false negatives Small effect size Small n Greater variance in scores Greater the error variance, the more Type II errors Type I (alpha) errors—false positives Stringency of the alpha error rate Significant Individual point p = 1.5 x 10⁻⁵ for genome-wide a = .05 Suggested individual point p = 3 x 10⁻⁴ for genome wide a = .63
Thus, lots of error variance will give us false negatives (Type II errors) when we do QTL analyses!
Pedagogical ObjectivesBioinformatics/Neuroinformatics Unit Review of genetics Review/introduction of statistical analyses and concepts Introduce QTL analysis Introduce bioinformatic tools Review/introduction of molecular techniques
QTL is good for detecting the approximate locus of multiple genes affecting a phenotype across all the chromosomes, except Y. This is a graph that displays the likelihood ratio statistic as a function of locus on the various chromosomes, which are numbered at top.
This is a PCR product for a marker— or Locus (remember Quantitative Trait Loci?) it is a small stretch of DNA that is different between the two different strains. A marker can be in any aspect of the DNA: gene, promoter, expressed sequence, intron, “junk,” etc., etc..
LRS is High X B X all X D D D D D D D D D D D D D Phenotypic Measurement (Residual) B B B B B B B B B B B B D B
LRS is LOW X all B D B D B B D D B X B B B D Phenotypic Measurement (Residual) D B X D B D D D B D D B D B D B
This line is the criterion for suggested level of significance. This line denotes the criterion for significance p < .05. Squiggly blue line is the LRS.
Clickable track to corresponding display in UCSC Genome Browser. Zooming in on Chromosome 6… Each Small colored box represents a known gene Likelihood ratio statistic SNP Density
QTL is good for detecting the approximate locus of multiple genes affecting a phenotype across all the chromosomes, except Y. This is a graph that displays the likelihood ratio statistic as a function of locus on the various chromosomes, which are numbered at top.
Pedagogical ObjectivesBioinformatics/Neuroinformatics Unit Review of genetics Review/introduction of statistical analyses and concepts Introduce QTL analysis Introduce bioinformatic tools Review/introduction of molecular techniques
QTL is good for detecting the approximate locus of multiple genes affecting a phenotype across all the chromosomes, except Y. This is a graph that displays the likelihood ratio statistic as a function of locus on the various chromosomes, which are numbered at top.
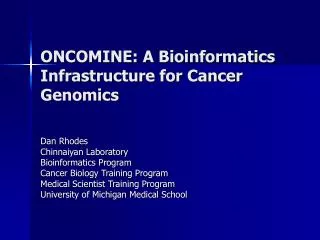
Bioinformatics Tools GeneNetwork--performs a QTL analysis and reveals LRS as a function of markers on chromosomes UCSC Genome Browser-- reveals known genes over a given region of chromosome--also gives--also provides relative expression levels of genes via “gene chips” Allen Brain Atlas provides in situ hybridization data--cell layers & cells in which gene is expressed. Entrez gene--sequence of given genes including coding sequence. PubMed--articles about given genes (& other stuff)
Pedagogical ObjectivesBioinformatics/Neuroinformatics Unit Review of genetics Review/introduction of statistical analyses and concepts Introduce QTL analysis Introduce bioinformatic tools Review/introduction of molecular techniques
This is a PCR product for a marker— or Locus (remember Quantitative Trait Loci?) it is a small stretch of DNA that is different between the two different strains. A marker can be in any aspect of the DNA: gene, promoter, expressed sequence, intron, “junk,” etc., etc..
Gene Chips DNA microarrays Can use fluorescent cDNAs (mRNAs or RNAs) as probes. Yield the pattern of gene expression across 2 different conditions. Can examine many (thousands) of genes at once. Does not give cell-by-cell resolution.
In situ hybridization • Finding out which cell(s) express a gene by probing for mRNA. • Probes to mRNA can be made of antisense DNA or RNA (sense is control). • Probes are labeled. • Probes hybridize with specific mRNAs being made in a cell. • Can only examine expression of one or two genes at a time.