Download
1 / 48
480 likes | 647 Views
Efficient handling of raw material variation in industry. Tormod Naes Ingunn Berget (post-doc) Kjetil Joergensen (Ph.D. student). Overview. IBION-project The problem. Handling raw material variation Why? Different aspects Building relevant models Data/design + modelling

E N D
Efficient handling of raw material variation in industry Tormod Naes Ingunn Berget (post-doc) Kjetil Joergensen (Ph.D. student)
Overview • IBION-project • The problem. Handling raw material variation • Why? • Different aspects • Building relevant models • Data/design + modelling • Different types of use of the equation • Robustness • Sorting • Continuous updating • Combinations • Robustness, validation
Industrial Biostatistics Network (IBION) www.ibion.no • Efficient use of raw materials in industry • The research project IBION (Industrial Biostatistics Network) is a consortium with partners from • five Norwegian bio-processing companies (Tine, Ewos, Stabburet, Mills, Borregaard) • the software and consulting company Prediktor and • three research institutes:-Department of mathematics, Agricultural University of Norway, AUN, Ås -Matforsk, Norwegian Food Research Institute, Ås-CPAC, University of Washington, Seattle. • The project is financed by the industrial partners and by The Research Council of Norway (NFR). • It was started July 1, 2001 and will continue until July 1, 2005. The total budget for the project is about 40 million NOK.
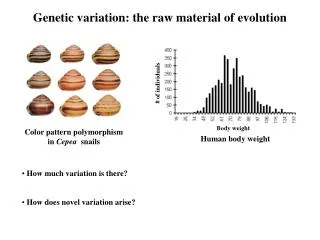
Handling raw material variationWhy important? • Raw materials vary in quality • Raw material costs represent a large portion of the total costs • Customers require goodh and stable quality
Handling raw material variation • Adjust processes to account for unwanted raw material variation • Stable, good quality • avoid waste • Utilise potential in raw material • Best raw materials for best product • Good combinations • Quality and cost
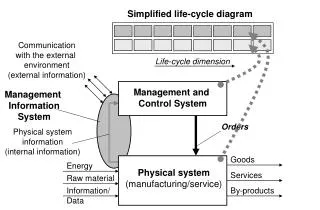
In all these cases We would like to have a model or a strategy that can be used to tell us what to do when a batch of raw material is received and characterised “process=f(raw materials, target values of output)”
Important • All serious industries have strategies and techniques for handling raw material variation (including the partners) • Expert knowledge, practical experience • We help them improving strategies • Using statistical/chemometric methods
Important criteria • Methods should be easy to use and understand • Results should be easy to interpret • Methods should stimulate to user interaction • Methods should be flexible/versatile/robust • Realistic validation of results
Important steps • Problem formulation • Measurements, where?, type?. • Data collection • Design or historical data? • Modelling • Type of model, variable selection • Use of the models • Interpretation, optimisation • Properties, robustness, validation • New round?
Collaboration • Typical area for collaboration • raw material knowledge • process knowledge • spectroscopy • statistics • Without close collaboration, no results!
Knowledge available • A large amount of useful components are avaialable • Experimental design • Empirical modelling (polynomials) • Variable selection • Optimisation • Validation • etc. • Little focus on this particular problem area
Raw material handling • The best that can be done prior to processing starts • Should be followed up by process monitoring and/or control strategies when appropriate.
Time Problem Description Process parameters Raw- materials Final Product Quality PROCESS
Different approaches • Robustness with respect to raw material variation • Continuous updating of process settings • Sorting of raw materials (define classes with corresponding optimal processing and with good properties in each) • Combinations • Useful for different situations, depending on local conditions
Two pieces of work done by studentsone related to modellingone related to use of models • Design and analysis strategy for situations with uncontrolled raw material variation • Jorgensen and Næs, (2004). J. Chem. (in press) • Optimal sorting of raw materials based on the predicted end product quality. • Berget and Næs (2002). Qual. Eng. • Batch oriented
A possible strategy for model buildingK. Jorgensen and T. Næs. (2004). J. Chem. (in press)Proposal for a strategy and a case study, cheese, Dry matter • End product quality = F(raw materials, process settings) • In practice often used inverted • Problems • Raw materials are natural products, can not be controlled/designed • How can we set up an experimental design? • Raw material characterisation • Time consuming • Sometimes one does not know what to measure
Possible solution • Design • Block design with raw materials as blocks • Measurements • Spectroscopy, use principal components of spectra directly in model end product quality=F(PC’s, process)
Experiment • 4 2-level factors + 3 2-level block factors • 7 factors in total • factorial design 24 in 8 blocks • protein content • renneting time • amount of starter culture added • coagulum cuting
PLS instead of PCA • Preliminary investigations based on simulations and real data indicate • PLS on the residuals (iteratively) gives better interpretability of spectral information (fewer components)
Conclusions • Block designs, with raw materials as blocks, combined with rapid characterisation of the raw materials: useful tool for model building. • (verified also in other experiments) • Using PC’s of spectra is flexible and does not need decisions about which properties to measure. Interpretation is important • First step towards a good model • Possible to interpret • Model is verified • Must may extended or fine-tuned by extra experiments to incorporate conlinearities etc. • Best possible combination of process variables and blocks? Research! • Combinations of collinear spectral data and factors. Research going on!
Utilising equations for process improvements • Some ideas, possibilities, feasibility • not finished industrial implementations • General goal: adjust process after measurement of raw material quality • Optimal for each batch • Optimal, but robust with respect to certain types of noise • A simpler strategy: Identify a small number of homogeneous raw material classes and their corresponding optimal process settings • robust with respect to measurement error of raw material measurements • simple in use (if difficult to change process) • well suited for situations where it is possible to sort. • Receive raw materials, sort, store in bins and process from same bin
Goal: • Reduce the effect of variable raw material quality • on end product quality • Procedure: • Identify optimal classes with corresponding processing conditions, • cluster analysis. • After identification: • measure raw material and put in best class (with known • processing conditions).
Industrial process with sorting RAW MATERIALS “POOR QUALITY” “GOOD QUALITY” PROCESS 1 PROCESS 2 END PRODUCT
Paper I Model: • Sorting: • i= object index (i= 1,…,n) • j= group index (j= 1,…,C) Distance between objects and groups = the loss from object i when it is allocated to category j y = end product quality x = process variables z = raw material variables n = number of objects C = number of categories T = Target Optimal sorting of raw materials, based on the predicted end product quality Model: Predicted quality = Raw material + Process Sorting: Predicted quality depends on category Objective: Minimise (Predicted quality - Target)2 for all objects in all categories
Fuzzy clustering • Fuzzy clustering as strategy for finding groups • Flexible with respect to distance • Easy to implement • Good convergence properties • Gives a quantitative description of how well each object fit in each cluster • Membership values • Numbers between 0 and 1 • Sum up to 1 for each object • Relative numbers
TARGET, T DATA Z ~p(z) Number of Categories (C) EXPERIMENTAL DATA X,Y, ZExp FUZZY CLUSTER ANALYSIS MEMBERSHIP VALUES U ={ui j} OPTIMAL PROCESS SETTINGS xo1, xo2,,…, xoc MODEL ŷ=f(x,z)
Example: Baking of hearth bread • Data taken from a study of baking process and flour quality* • 10 flour blends • 3 levels of mixing and proofing time ( = resting time after dough has been shaped) • 90 combinations of flours and baking process • Response: bread loaf volume *Færgestad, E. M. et al. Influence of flour quality and baking process on hearth bread characteristics using gentle mixing. Journal of Cereal Science1999, 30 61-70.
Input to cluster analysis • MODEL z1 protein x1 mixing time x2 proofing time y volume • Target • T=530 mL • Raw material data • 100 equally spaced points within experimental region (10.2 - 14.3% protein) • Number of groups • C=2
loss Membership values and loss
Optimal process settings Convergence properties With two groups the clustering algorithm converges in less than 20 iterations. More iterations needed with more groups. No sensitivity to different initialisations. Results
Volume = 354 ml Form ratio = 0.64 (height/width) … but what about bread shape? Volume = 352 ml Form ratio = 0.52 (height/width)
Paper II Sorting of raw materials with focus on multiple end-product properties • Product quality is often defined by several product characteristics • Different responses have different optima • Example: volume and form ratio • longer proofing times give larger, but flatter breads
Suggested approaches • Optimise one response under constraints on the others • Convergence problems in investigated example • Weighted squared loss • Use weights to prioritise responses • Desirability functions • Functions of predicted product quality
Alternatively RAW MATERIALS POOR QUALITY GOOD QUALITY PROCESS 1 PROCESS 2 PRODUCT 1 PRODUCT 2
Assessing robustness • Various approaches exist • Box et al, optimisation of polynomials models • Bootstrapping (parametric) for assessing robustness • Estimate model. • Simulate data from the model • Repeat optimisations. • Visualise the optimal points
Can also be used in other situations • Robustness of robust process optimization • Mevik(2003) Qual. Eng. • Some variables controlled, robustness to others • robustness to model and target uncertainty • Product and process improvement using mixture-process variable design and robust optimization techniques. • Sahni, Piepel and Næs (2004), in prep. • Some variables controlled, robustness to other (mixture-process) • robustness to coefficient and model selection uncertainty
Paper IV Robustness of prediction sorting • Results • Memberships and optimal process settings are variable when regression coefficients are uncertain. • Misclassification rate due to variable membership values is small. • Average error in predicted response due to variable optimal process settings small compared to the prediction error • Indicate that prediction sorting is rather robust to random error in the regression coefficients. • Paper submitted
List of papers • I. Berget and T. Næs. “Optimal sorting of raw materials, based on the predicted end-product quality”. Quality Engineering (2002) 14 (3) 459-478 • I. Berget and T. Næs, “Sorting of raw materials with focus on multiple end-product properties”. Journal of Chemometrics (2002) 16 263-273 • I. Berget, A. Aamodt, E. M. Færgestad and T. Næs. “Optimal sorting of raw materials for use in different products”. Journal of Chemometrics and Intelligent Laboratory systems (in press). • I. Berget and T. Næs. “Robustness of prediction sorting”. (submitted)
Conclusions • Fuzzy clustering combined with suitable distance measure can be used for sorting • Robust splitting and reasonably robust process settings • Clear improvements over non-sorting • Method can be extended to multivariate data and can be penalised • Bootstrap can be used for evaluating robustness