Download
1 / 12
120 likes | 226 Views
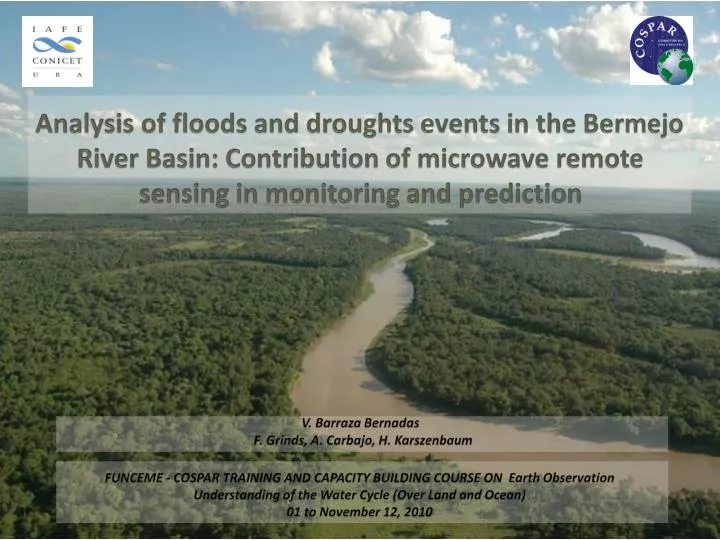
Analysis of floods and droughts events in the Bermejo River Basin: Contribution of microwave remote sensing in monitoring and prediction . V. Barraza Bernadas F. Grinds, A. Carbajo , H. Karszenbaum.

E N D
Analysis of floods and droughts events in the Bermejo River Basin: Contribution of microwave remote sensing in monitoring and prediction V. BarrazaBernadas F. Grinds, A. Carbajo, H. Karszenbaum FUNCEME - COSPAR TRAINING AND CAPACITY BUILDING COURSE ON Earth Observation Understanding of the Water Cycle (Over Land and Ocean) 01 to November 12, 2010
Introduction • Floods and droughts are the most important hydrological disturbances in intermittent streams. • The concept of hydrological disturbance is strongly related to the ecosystem dynamics. • The hydrologic mechanisms underlying the climate-soil-vegetation dynamics control the most basic ecologic patterns and processes. Eco-hydrology is the science that studies the mutual interaction between the hydrological cycle and the ecosystems. Remote sensing provides an useful approach toward measuring important elements of the hydrological balance and vegetation monitoring.
ThesisObjectives • Map the hydrological behavior of the Bermejo watershed using microwave systems (AMSR-E, SMOS and SAC-D Aquarius) and optical systems (MODIS), with special emphasis in the analysis of multitemporal series (2002-on). • Use optical images to obtain patterns of NDVI and enhanced vegetation index (EVI) at regional level, from TERRA-AQUA MODIS time series that accounts for ecosystem dynamics related to flood and drought events.
Study Area Bermejo River Basin • The Bermejo River is one of the main tributaries of the Paraguay-Paraná River system, and flows from south-west Bolivia to north-east Argentina through a variety of habitats from the Andean Chain to the plains of the lower Chaco. • It is the only river that crosses completely the huge Chaco Plains, behavingas a corridor for the connection of biotic elements of both the Andean mountains and the Chaco Plains. • It is one of the rivers plains with the largest solid discharge of the world.
Introduction • Hydrological variables • Microwave passive systems have advantages over the optical ones related to hydrological variables. • Frequency (1-30GHz) passive microwave studies can reveal large scale inundation patterns even in the presence of cloud cover and dense vegetation. • Provides low resolution brightness temperature (Tb) data (~ hundreds of Km2), characterized by a high temporal resolution (~ 2-3 days). • The measured brightness temperature of the terrain is related to soil dielectric constant and ultimately, to its flood condition.
Available data • AMSR-E • data from 2002-on. • microwave radiometer operating at six frequency bands: 6.925 GHz (C), 10.65 GHz (X), 18.7 GHz (Ku), 23.8 GHz, 36.5 GHz (Ka), and 89.0 GHz, and two polarizations (H y V). • The IFOV is dependent on frequency, going from 43 x 75 km at C Band to 8 X 14 km at Ka band. • In order to compare among different frequencies, we are using products with the same resolution (AMSR-E Res-1). • We have adopted a repetition time of 16 days, which corresponds to the exact repeat orbit. • SAC-D Aquarius and SMOS will be providing data for L band (1.3 GHz). Work in progress Processing AMSR-E data of all frequencies from 2002-on
Estimating flooded area and mean water levelBasic model [Hamilton, 2002] • The model has three end-members, that represent the contributions of water, non-flooded land, and inundated floodplain to the total observed polarization difference ΔTobs, where ΔTobs is the ΔT observed by the radiometer, fw, fnf and ff are the fractional areas of open water (rivers and lakes without emergent vegetation), non-flooded land, and seasonally flooded land, respectively, andΔTw, ΔTnf, and ΔTf are the ΔT values for open water, non-flooded land, and seasonally flooded land. • Simultaneous solution of these equations yields the following equation for the fraction of inundated floodplain (ff):
Introduction Vegetation dynamic. • Vegetation Index analysis is one of the techniques most frequently used in remote sensing to estimate the type/quality/biomass of the vegetation. • There is huge experimental evidence that shows that the temporal variation of NDVI can be used to evaluate vegetation phenological patterns and to monitor landuse/landcover change. • Normalized Difference Vegetation Index NDVI= (NIR – RED)/(NIR + RED) NDVI is based on the reflection properties of green vegetation and is determined by the ratio of the amount of absorption by chlorophyll in the red wavelength (600–700 nm) to the reflectance of the near infrared (720–1300 nm) radiation.
Vegetationdynamics • NDVI data from MODIS sensor, with 250 m spatial resolution and a revisit period of once each 16 days from 2002-on. • Moderate temporal evolution of NDVI • The main advantage of this type of model is that it is sufficiently complex to provide a good fit, and simple enough to have an ecological interpretation for each parameter.
Publications • F. Grings, V. Douna, V. Barraza, M. Salvia, H. Karszenbaum, N. Gasparri, P. Ferrazzoli y R. Rahmoune. C band radiometric response to rainfall events in the subtropical Chaco forest. (submitted). • M. Salvia, F. Grings, P. Ferrazzoli, V. Barraza, V. Douna, P. Perna y H. Karszenbaum. Estimating flooded area and mean water level using active and passive microwaves: The example of Paraná River Delta floodplain (submitted). Project • La Plata Basin floods and droughts: Contribution of microwave remote sensing in monitoring and prediction. SAC-D Aquarius AO- CONAE-NASA. PI: HaydeeKarszenbaum