Download
1 / 20
200 likes | 320 Views
Ecology Lab Population Estimation (Week 1). Population Estimation. PURPOSE: To compare the three different population estimation methods Enumeration Mark/Recapture Depletion HYPOTHESES: Null (H 0 ): Enumeration = Mark/Recap = Depletion

E N D
Population Estimation • PURPOSE: • To compare the three different population estimation methods • Enumeration • Mark/Recapture • Depletion • HYPOTHESES: • Null (H0): Enumeration = Mark/Recap = Depletion • Alternative (HA): Enumeration ≠ Mark/Recap ≠ Depletion
Method 1: Enumeration • P = sum of all individuals • MINIMUM estimation • Assumptions • All individuals are captured • Removal of individuals did not attract others into study area (vacuum effect) • No births or deaths during the study
Method 2: Mark/Recapture • P = M x C R • M : # collected and marked during first sample • C : # collected during second week sample • R : # marked in the second sample • Assumptions: • All individuals are equally likely to be caught • Marked individuals are randomly dispersed • Marked individuals must not become easier or more difficult to catch than unmarked individuals. • No births, deaths, or migration
Method 3: Depletion • Collect and remove • Collect and remove • Collect and remove (a constant fraction of the remaining population is taken with each sample) • Apply a trendline and predict total population • P= where the trendline crosses the x-axis • Assumptions • No births, deaths, or migration • Probability of capture does not change • Probability of capture is the same for each individual
Method 3: Depletion 8/20 = 0.40 5/12 = 0.41 3/7 = 0.42 Collect and remove Collect and remove Collect and remove
Depletion Graph X-axis: # snails collected so far Y-axis: #of snails collected in current sample * Where trendline crossed X-axis is your population estimate!
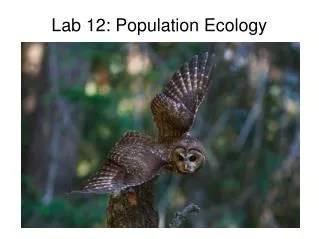
Why are we using snails?Yellow elimia (Elimiaflava) • Small home range • few square meters • Pop sizes stable • live for several years • Easy to catch and mark • Abundant • unless Eco lab has been collecting them all week…
Snail Sampling Method • 200 collection minutes • 5 groups of 4 • 10 min each • Volunteer group of 4 to go twice • Process • Collect snails • Dry snails • Mark all snails with paint pen (on bottom of the shell!) • Bring all snails back to lab • Last lab of the week will release ALL the snails collected all week.
Creek Characteristics • Measure: • Air temp • Water temp • Water clarity (can you see the bottom?) • Depth • using meter stick at designated place • Velocity • meter stick and leaf in designated place
Same as week 1 except: No marking snails Keep track of: # marked (and what color) # unmarked 200 minutes of search time outside study area (to test for emigration): 10 people search upstream for 10 minutes 10 people search downstream for 10 minutes Bring all snails from study plot back to lab (but only the marked migrants!) for Friday release! Week Two Methods
Creek Characteristics • Measure (Again): • Air temp • Water temp • Water clarity (can you see the bottom?) • Depth • using meter stick at designated place • Velocity • meter stick and leaf in designated place
Review: Population Estimation • PURPOSE: • To compare the three different population estimation methods • Enumeration • Mark/Recapture • Depletion • HYPOTHESES: • Null (H0): Enumeration = Mark/Recap = Depletion • Alternative (HA): Enumeration ≠ Mark/Recap ≠ Depletion
Why estimate population size?How is this tool valuble? • Can be an indicator of: • species health • habitat quality • ecosystem or community health • If done repeatedly over time, changes in population and its surroundings can be tracked • especially threatened/endangered species • Used in management decisions • Hunting/fishing licenses • How areas are used in state/national parks
Method 1: Enumeration • P = sum of all individuals • MINIMUM estimation • Assumptions • All individuals are captured • Removal of individuals did not attract others into study area (vacuum effect) • No births or deaths during the study
Method 2: Mark/Recapture • P = M x C R • M : # collected and marked during first sample • C : # collected during second week sample • R : # marked in the second sample • Assumptions: • All individuals are equally likely to be caught • Marked individuals are randomly dispersed • Marked individuals must not become easier or more difficult to catch than unmarked individuals. • No births, deaths, or migration
Method 3: Depletion • Collect and remove • Collect and remove • Collect and remove (a constant fraction of the remaining population is taken with each sample) • Apply a trendline and predict total population • P= where the trendline crosses the x-axis • Assumptions • No births, deaths, or migration • Probability of capture does not change • Probability of capture is the same for each individual
Depletion Graph * Where trendline crossed X-axis is your population estimate!