Download
1 / 25
250 likes | 348 Views
Understanding and Using Feedback from the Primary Information Systems. Dr Chris Jellis chris.jellis@cem.dur.ac.uk. PIPS and InCAS have Different Feedback. PIPS feedback uses Standardised Scores Good for comparing yeargroups and cohorts Good for assigning pupils to ability groups

E N D
Understanding and Using Feedback from the Primary Information Systems Dr Chris Jellis chris.jellis@cem.dur.ac.uk
PIPS and InCAS have Different Feedback • PIPS feedback uses Standardised Scores • Good for comparing yeargroups and cohorts • Good for assigning pupils to ability groups • Good for measuring progress • InCAS feedback uses age equivalent scores • Gives a good idea of how far ahead or behind individual pupils are • Good to use diagnostically
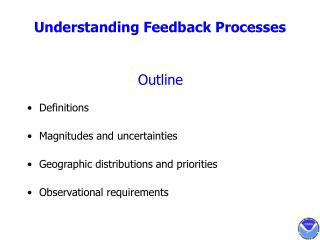
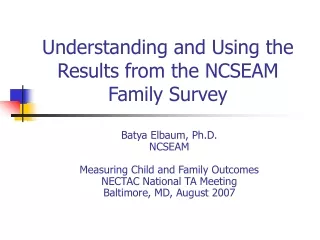
PIPS Reception • Provides initial information about pupils when they enter the school • Provides progress information for the Reception year • Most feedback is similar to later years PIPS, with a couple of exceptions
Early Reading Early Maths 20 30 40 50 60 70 80 Start of Reception Box and Whisker Standardised scores
160 160 140 140 120 120 100 100 Reading Raw Scores (End) Reading Raw Scores (Start) 80 80 60 60 40 40 20 20 0 0 Start End End of ReceptionLine Graph
PIPS Feedback • Standardised Scores Table • Grades Table • Value Added Scatter Plot • Key Stage Chances
Standardised Scores • Mean of 50, Standard Deviation of 10 • Between 40 and 60 – Average (68%) • Between 30 and 40 – Below average (14%) • Below 30 – well below average (2%) • Between 60 and 70 – Above average (14%) • Above 70 – Well above average (2%)
Year 3 Scatter Plot 75 25 30 35 40 45 50 55 60 65 70 30 35 40 45 50 55 60 65 70 70 70 70 Brian 65 65 65 David Amanda Nicole Michael Daniel 60 60 60 Chloe Scott Andrew Roger 55 55 55 Callum Faye Karen Kate Vicky 50 50 50 Attainment Score Harry Christine Stephen 45 45 45 Helen Susan Luke John 40 40 40 35 35 35 30 30 30 25 2 25 25 30 35 40 45 50 55 60 65 70 75 Context Score
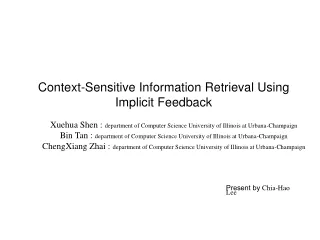
InCAS Feedback • Age Equivalent Scores Table • Differences Table • Box and Whisker Plots • Diagnostic data • Longitudinal plots • Standardised scores
Box and Whisker Plot (single class)
Box and Whisker Plot (multiple classes)
Standardised Scores Mean = 100, sd = 15
Standardised Scores • Mean of 100, Standard Deviation of 15 • Between 85 and 115 – Average (68%) • Between 70 and 85 – Below average (14%) • Below 70 – Well below average (2%) • Between 115 and 130 – Above average (14%) • Above 130 – Well above average (2%)
PIPS Standardised scores are more difficult to understand, but good for comparing children and groups InCAS Age scores are clearer, but with no standard deviation, it is difficult to tell what the range is Comparing InCAS and PIPS
InCAS Administer at any time of year CD (installed on school network) Group assessment Feedback Within 24 hours PIPS Fixed assessment periods Pencil and paper or CD (installed on school network) Group assessment Feedback Approx 6 weeks for pencil and paper Quicker for CD Administration
So, which do you choose? • To establish a baseline (particularly in the early years) and show progress - PIPS • If the group is not average – InCAS • If you need diagnostic information – InCAS • Some schools do both
Any Questions? Dr Chris Jellis Research Associate CEM