Download
1 / 20
200 likes | 486 Views
Comparative Data Analytics Office of Performance Improvement Anne Park. MD Anderson Cancer Care Patient Care. MD Anderson is accredited by the Joint Commission, an organization that ensures patients receive the best and safest health care possible.

E N D
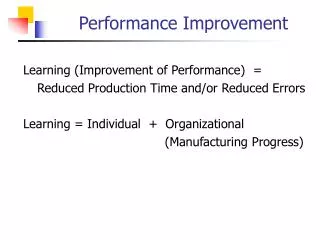
Comparative Data AnalyticsOffice of Performance ImprovementAnne Park
MD Anderson Cancer Care Patient Care • MD Anderson is accredited by the Joint Commission, an organization that ensures patients receive the best and safest health care possible. • The nursing program holds Magnet Nursing Services Recognition status from the American Nurses Credentialing Center. • For ten of the past 12 years, including 2013, MD Anderson has ranked No. 1 in cancer care in the “Best Hospitals” survey published by U.S. News & World Report. • MD Anderson provided $212 million in uncompensated care to Texans with cancer in FY12. This figure includes unreimbursed costs of care for patients who either have no insurance or are underinsured, or whose care was not fully covered by government-sponsored health programs. • The new Sheikh Khalifa Bin Zayed Al Nahyan Institute for Personalized Care Therapy will be an international center of clinical excellence focusing on using the latest advances in genetic testing to develop safer, more effective treatments for patients on a case-by-case basis.
Office of Performance Improvement Clinical Operations Informatics: Clinical Operations informatics, which is part of Office of Performance Improvement, provides accurate and actionable process and outcome data, including dashboards, reports, external reporting and benchmarking capability. Our team uses the patient-centric Enterprise Information Warehouse (EIW) as well as other internal and external data sources to provide data analyses and research to provide reports, analysis and other information for patient care, research and operational decision making.
Performance Metrics • Rapid Quality Reporting System (RQRS) • The Joint Commission’s Core Measures (AMI, HF, SCIP, PN) • National Surgical Quality Improvement Projects (NSQIP) Measures • Ongoing Professional Profile Evaluation (OPPE) • Press Ganey Patient Satisfaction Survey • Comprehensive Cancer Center Consortium Initiatives (C4QI) • The Joint Commission (TJC) Core Measures & National Patient Safety Goals (NPSG) • Physician Quality Reporting & Value Based Payment Modifier (PQRS) • Value Base Purchasing (VBP)
Economic of Healthcare Top 1% spent >20% of spending ($275 billions) Top 5% spent >50% of spending ($623 billions) Bottom 50% spent 2.9% of spending ($36 billions) $36 Billons $1,223 Billons
What to do about it? FUTURE bottom line cost control by eliminate waste & improve operation efficiency (evidence base practice, standardization, and benchmark) “Top-line” revenue enhancement of complex cases for fee for services patients (medical tourism: international & out of state) PAST
About UHC • Member-owned alliance of more than 95% of the nation’s nonprofit AMCs and their affiliates • Started by AMCs in the 1984 • UHC provides comparative databases, associated services, a Group Purchasing Organization, and networking opportunities • Specific competencies in comparative data, performance improvement, networking, supply chain, and revenue enhancement 119 Principal Members Academic Medical Centers (AMCs) 293 General Members Teaching hospitals and community affiliates of principal members 202 Many of the participating hospitals submits outpatient discharges
What is CDB/RM? Clinical Data Base (CDB) • Web tool that participating hospitals can benchmark openly with other hospitals by accessing transparent, web-enabled database • Comparison of risk-adjusted outcomes for LOS, Mortality, and Cost Goal: Performance Improvement Resource Manager (RM) • Line item charge detail • Seven key categories: Accommodation, Blood, Imaging, Lab, Med Surgical Supply, Pharmacy, & Cardiovascular Goal: identify trends/patterns, connect usage with outcomes, advance cost management initiatives
Similarities/Differences between CDB and CRM CDB is the foundation • Patient Level (demographics, diagnoses, procedures, outcomes) • Aggregated transactions (defined by revenue code groupings) • Contains all transactions v • RM enhances CDB’s foundation • Charge Codes (Master Files) • Detailed transactions (guided by revenue codes by identified but descriptions) • Filters include only high impact transactions in most areas including pharmacy • Pharmacy is the exception –more extensive list
Risk Adjustment Accounting for patient-related attributes, such as age, gender, or pre-existing conditions, so that comparison of health care measures among hospitals seeing different mixes of patients is as fair and meaningful as possible. • Benchmarking & Quality Improvement • To provide patient level predictions that can be compared with other similar patients (expected values) • To provide aggregate level predictions that can be compared with other hospital aggregations (observed / expected ratio)
What can we do? • Review individual patients • Case counts and look-ups by: condition, procedure, physician, PSI, HAC, etc. • Compare results within and across hospitals - How are we doing? - Who’s doing it better? Can we learn from them? - ‘But our patients are sicker’ • Identify improvement opportunities - Process and Performance - Documentation and Coding
LOS, Mortality, and Direct Cost Indices Decrease Observed Value Clinical Practice Coding and Documen- tation Increase Expected Value
2013 to 2014 US News and World Report: Top 20 Hospitals for Cancer Care
Make It Actionable • Determine key areas with high impact, value, and relevance and focus • Change metrics with the changing times & improved performance • Ensure focus areas are within the scope of influence • Provide constructive feedback
References Anne Park, Sr. Business Systems Analyst at akpark@mdanderson.org or 713.745.4817