Download

1 / 20
200 likes | 328 Views
Enzyme Biosensor. Detection of glycerides in biodiesel. Team Members: Ben Wilson Matt Yourek Megan Templeton. Mentors: Dr. Tom Hess Dr. Dev Shrestha. Client: Dr . Dev Shrestha. Presentation Overview. Opportunity Statement Current Testing Method Product Specifications

E N D
Enzyme Biosensor Detection of glycerides in biodiesel Team Members: Ben Wilson Matt Yourek Megan Templeton Mentors: Dr. Tom Hess Dr. Dev Shrestha Client: Dr. Dev Shrestha
Presentation Overview Opportunity Statement Current Testing Method Product Specifications Housing Design Circuit Design Membrane Experimentation Experimental Design Parameter Measurements Results Recommendations
Opportunity Statement Design, fabricate, and test a handheld biosensor that uses a modified pH meter combined with an immobilized enzyme electrode to detect the amount of free and total glycerol in a sample of biodiesel.
Current Testing Method Currently biodiesel makers use a gas chromatograph to measure the amount of glycerol within their biodiesel. While the GC provides a very accurate measurement, it is a time consuming process to prepare and test a sample.
Product Specifications Light weight – total weight of less than 5lbs Small – have a footprint smaller than half a sheet of paper Durable – able to withstand drops and bumps Reusable – can test multiple samples with one membrane Fast – easily calculates concentration percent in seconds Simple – minimal buttons and good user feedback Accurate – Consistent voltage signal for each sample Easy to Calibrate – a single button push resets reference voltage
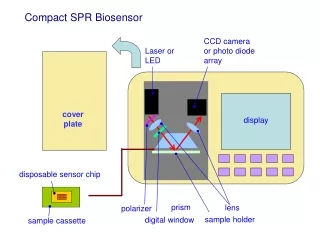
Housing Design Fabricated using the Mechanical Engineering Department ABS plastic rapid prototype printer 3/16” wall thickness 1” x 6” x 3.5” internal space Six attachment points Separate battery compartment Circuit board attachment points
Circuit Design Major Components Op – Amps RC Filter Arduino UNO
Circuit Design LM741CN Simple operational amplifier Forces voltage signal to be positive by adding a constant voltage to the measured signal AD623AN Variable gain operational amplifier Amplifies voltage signal so small changes can be recognized by the Arduino
Circuit Design RC Filter Uses a resistor and a capacitor in series to filter the signal Removes high frequency signal noise added during amplification The cutoff frequency (Hz) is calculated using the equation
Circuit Design Arduino UNO Registers user input through buttons Reads voltage from probe and assigns bit value to corresponding variable Blinks LED to verify that a button has been pushed Writes valuable information to LCD screen Processes input voltage from probe by removing the added voltage and converting to concentration percent
Circuit Design The Biosensor was calibrated using a DC voltage source and a digital multimeter A line was then fit to the data using the Matlab fitting tool The calibration equation was then programmed into the Arduino, so the true signal voltage is displayed
Membrane • Initially going to test three types of membranes • PVA • PVDF • Water emulsion
Membrane Membrane Failure • In the beginning the membrane easily degraded • Then even the thinnest layers of membrane were too thick to record accurate measurements • Determined to add lipase directly to solution
Experimentation • Ran 32 experiments testing four variables: • Feedstock • Lipase • Temperature • Soap
Experimental Design Variables ANOVA - Identify significant variables Regression Analysis - Identify optimal combinations Feed - Oil - Biodiesel Temp. - 20°C - 40°C Lipase - 20 mg - 10 mg Soap - 1 ml - no soap Calibration
Parameter Measurements Point Measurements: Time-based Sampling: • Initial pH • Initial mV • Final pH • Final mV • Δ pH • Δ mV
Results Significant Variable: Optimal Combination: Feedstock 20 mg lipase, 20°C, 1 ml soap
Recommendations Construct calibration curve from biodiesel samples with known concentration of total glycerides. True concentration is determined by gas chromatography (GC) Validate curve with GC analysis Gain better understanding of reaction mechanism driving the pH change Determine membrane composition and thickness having the least impact on probe sensitivity