Download
1 / 1
20 likes | 201 Views
Organic bulk heterojunction (BHJ) solar cells Organic solar cells attractive because of their low cost, low weight, and flexibility. BHJ solar cells: a polymer-fullerene blend spontaneously phase separates to form a vertically-structured cell with nanoscale heterojunctions .

E N D
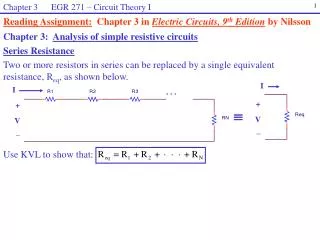
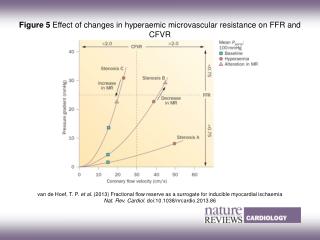
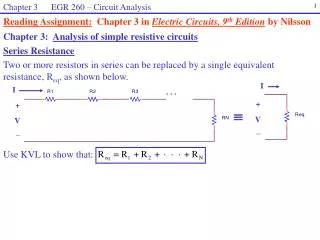
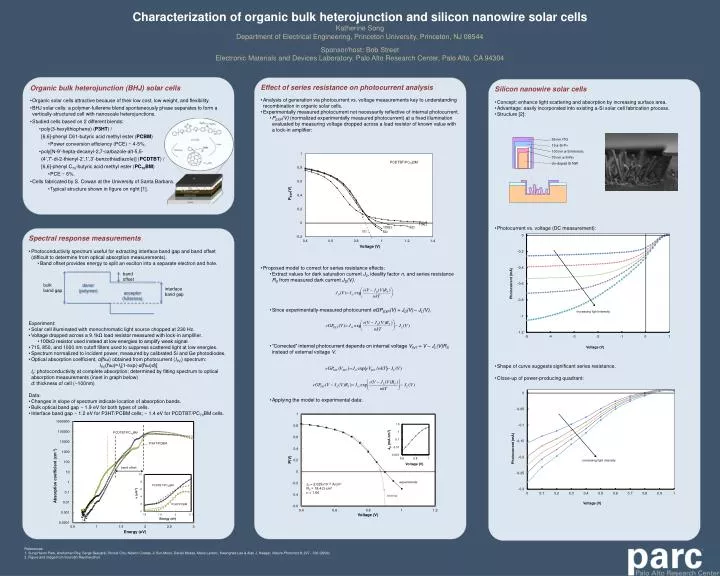
Organic bulk heterojunction (BHJ) solar cells • Organic solar cells attractive because of their low cost, low weight, and flexibility. • BHJ solar cells: a polymer-fullerene blend spontaneously phase separates to form a vertically-structured cell with nanoscaleheterojunctions. • Studied cells based on 2 different blends: • poly(3-hexylthiophene) (P3HT) / • [6,6]-phenyl C61-butyric acid methyl ester (PCBM) • Power conversion efficiency (PCE) ~ 4-5%. • poly[N-9’-hepta-decanyl-2,7-carbazole-alt-5,5- • (4’,7’-di-2-thienyl-2’,1’,3’-benzothiadiazole)] (PCDTBT) / • [6,6]-phenyl C70-butyric acid methyl ester (PC70BM) • PCE ~ 6%. • Cells fabricated by S. Cowan at the University of Santa Barbara. • Typical structure shown in figure on right [1]. • Effect of series resistance on photocurrent analysis • Analysis of generation via photocurrent vs. voltage measurements key to understanding recombination in organic solar cells. • Experimentally measured photocurrent not necessarily reflective of internal photocurrent. • PEXP(V) (normalized experimentally measured photocurrent) at a fixed illumination evaluated by measuring voltage dropped across a load resistor of known value with a lock-in amplifier: • Proposed model to correct for series resistance effects: • Extract values for dark saturation current J0, ideality factor n, and series resistance RS from measured dark current JD(V). • Since experimentally-measured photocurrent eGPEXP(V) = JD(V)– JL(V), • “Corrected” internal photocurrent depends on internal voltage VINT = V –JL(V)RS instead of external voltage V. • Applying the model to experimental data: • Silicon nanowire solar cells • Concept: enhance light scattering and absorption by increasing surface area. • Advantage: easily incorporated into existing a-Si solar cell fabrication process. • Structure [2]: • Photocurrent vs. voltage (DC measurement): • Shape of curve suggests significant series resistance. • Close-up of power-producing quadrant: Characterization of organic bulk heterojunction and silicon nanowire solar cellsKatherine SongDepartment of Electrical Engineering, Princeton University, Princeton, NJ 08544Sponsor/host: Bob StreetElectronic Materials and Devices Laboratory, Palo Alto Research Center, Palo Alto, CA 94304 • Spectral response measurements • Photoconductivity spectrum useful for extracting interface band gap and band offset (difficult to determine from optical absorption measurements). • Band offset provides energy to split an exciton into a separate electron and hole. • Experiment: • Solar cell illuminated with monochromatic light source chopped at 230 Hz. • Voltage dropped across a 9.1kΩ load resistor measured with lock-in amplifier. • 100kΩ resistor used instead at low energies to amplify weak signal. • 715, 850, and 1000 nm cutoff filters used to suppress scattered light at low energies. • Spectrum normalized to incident power, measured by calibrated Si and Ge photodiodes. • Optical absorption coefficient, α(ħω) obtained from photocurrent (IPC) spectrum: • IPC(ħω)=I0[1-exp(-α(ħω)d)] • I0: photoconductivity at complete absorption; determined by fitting spectrum to optical absorption measurements (inset in graph below) • d: thickness of cell (~100nm) • Data: • Changes in slope of spectrum indicate location of absorption bands. • Bulk optical band gap ~ 1.9 eV for both types of cells. • Interface band gap ~ 1.2 eV for P3HT/PCBM cells; ~ 1.4 eV for PCDTBT/PC70BM cells. band offset donor (polymer) bulk band gap interface band gap acceptor (fullerene) band offset References: 1. Sung Heum Park, Anshuman Roy, Serge Beaupré, Shinuk Cho, Nelson Coates, Ji Sun Moon, Daniel Moses, Mario Leclerc, Kwanghee Lee & Alan J. Heeger, Nature Photonics3, 297 - 302 (2009). 2. Figure and image from SourobhRaychaudhuri.