Download
1 / 31
310 likes | 397 Views
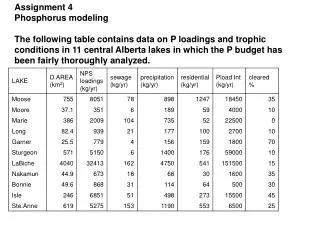
The Contamination of Phosphorus in 4 Different Locations. Jess Withey Research Advisor: Dr. Carl Binz Secondary Advisor: Dr. Edward Maslowski May 2013 Senior Biochemistry Thesis. Objectives. The main objectives for the presented research were :

E N D
The Contamination of Phosphorus in 4 Different Locations Jess Withey Research Advisor: Dr. Carl Binz Secondary Advisor: Dr. Edward Maslowski May 2013 Senior Biochemistry Thesis
Objectives The main objectives for the presented research were: • To analyze total phosphorus concentration using an absorbicacid method of spectrometry • Reflects the level of phosphorus in water • Measure of both soluble and non-soluble organic phosphorus • To compare the concentrations of phosphorus in four different locations that relate to the Mississippi River including: • Pike Lake Chain; Park Falls, Wisconsin • Flambeau River; Park Falls, Wisconsin • Mississippi River; Dubuque, Iowa • Mississippi River; Clinton, Iowa
Background • Form phosphates (PO4-3) • Exist in 3 forms: • Orthophosphate-produced by natural processes and are found in sewage • Metaphosphate-treat boiler waters and are in detergents • Organically bound phosphate-important in nature; result from the breakdown of organic pesticides • May exist as loose fragments in solution or in bodies of aquatic organisms • Occur in minerals and foods • Found in oceans—very low at surface and increases as depth increases due to organic debris • Found in rivers and lakes—results in generating excessive algae growth
Pollutant Sources of Phosphorus • Wastewater and Septic System Effluent • Detergents • Fertilizers, Leaves, Grass Clippings • Animal Waste • Development/Paved Surfaces • Industrial Discharge • Forest Fires
Phosphorus Health Effects • Phosphorus is a dietary requirement with the recommended intake being 700mg/day (normal diet provides 1000-2000mg/day) • Phosphorus exists as phosphate. • Considered as the second most profuse/abundant mineral in the human body. • Essential for activities for the brain, kidneys, heart, and blood
Occur in Minerals & Foods • Eggs • Meats • Poultry • Fish • Nuts • Dairy Products • Sunflower Seeds • Rice • White Bread • Potatoes • Broccoli • Peas • Peanut Butter • Tuna • Pork
Functions • Growth and Development • Bone Formation • Digestion • Excretion • Weakness • Brain Function • Protein Formation • Hormone Balance • Energy Extraction • Cell Repair • Chemical Reactions/Production of Energy
Excessive Intake in Humans • Diarrhea • Calcification in organs and soft tissue (kidneys) • Prevent absorption of iron, calcium, magnesium, and zinc • Reduces Vitamin D production and blood calcium • Kidney Damage • Osteoporosis
Environmental Intake • Needed by plants to produce energy and for their reproductive systems • Essential for the successful early establishment of vegetables, flowers, and lawn grasses.
Phosphorus Environmental Effects • Algae growth is limited by the available supply of phosphorus, so large amounts can trigger large quantity growth • When algae die, they are decomposed by bacteria, which use dissolved oxygen. • Oxygen concentrations can drop too low leaving fish and other aquatic organisms with the inability to breath, resulting in death.
Eutrophilication • Process that results from accumulation of nutrients in lakes or other water bodies • “The aging of lakes” • Natural process that takes thousands of years • Can be greatly accelerated by human activities that increase the rate at which nutrients enter the water
Reducing Phosphorus Contaminants • Effective nutrient management • Keep leaves, tree seeds and lawn clippings out of gutters, streets, and ditches • Pick up pet waste • Control soil erosion • Phosphorus information regarding: • Fertilizer recommendations • Phosphorus index • Research projects • Water quality impact
Pike Lake • 806 acres • Mean depth=11ft • Max depth=17ft • pH=6.2-6.7 • Water brown in color • Tamrick tree swamps • Inflowing streams from wetland drainage • Formed approximately 10,000 years ago during last glacial retreat from WI.
High Drainage areas to Pike Lake: • Direct watershed: land area that drains to the lake by runoff • Contributing watershed: land areas that drain to the lake by way of a defined channel/stream • Total watershed: the direct drainage watershed area plus the contributing watershed area • Drainage areas dominated by forests and wetlands, as well as 3 other lakes connected and their creeks. • All drainage areas contribute to the chain’s large phosphate concentration.
Bottom of lake contains some of the highest available phosphorous of any soil in WI. • Stream inputs • Boat traffic • Sediment resuspension • Phosphorous generates algae blooms and weeds. • Nitrates present due to septic systems. • Iron and sulfur present from rocks.
Hypothesis • The water samples will decrease in molarity starting from Northern Wisconsin (Pike Lake) to the southern part of the Mississippi River in Clinton, Iowa.
Methods/Procedure • Testing strips can detect phosphate ions in water. • Didn’t go low enough in concentration
Methods/Procedure • Water samples containing phosphorus were collected once a month from December to April 2013. • The standard stock solution was prepared from sodium phosphate (1.00x10⁻³M) to prepare a calibration curve to help analyze the collected samples. • The stock solutions were then diluted to the predicted range of the sample solutions: (1.00x10⁻⁴M, 5.5x10⁻⁵M,1.00x10-6M) • 1mL of ammonium molybdate was added to 5mL of the water sample. • 0.7mL of aminonaphtholsulfonic acid reagent was added. • Samples were left to sit for 30 minutes with continuous swirling. • Absorbance values were measured at 690nm using an OceanOptics UV Vis Spectrometer.
The three standards were plotted to determine the experiment’s calibration curve. • Beers Lamberts Law was applied to analyze and determine the unknown concentrations. Beers Law A = ε b c “ε " is the molar absorptivity (in units of per molar per cm, M-1 cm-1) "b" is the path length (in units of centimeters, cm), "c" is the concentration (in units of morality , M).
Figure 1. represents an example of a water sample test from the standard stock solution and the standards that were prepared to determine the experiment’s calibration curve. The unknown concentrations of the water samples were then derived using the absorbance and concentration curve, as shown above.
The exact concentration of total phosphorus in the samples were determined and shown below: Area of SamplesConcentration Ranges: • Pike Lake, Park Falls, WI 2.85x10⁻⁵-3.03x10⁻⁵M • Flambeau River, Park Falls, WI 1.63x10⁻⁵-2.03x10⁻⁵M • Mississippi River, Dubuque, IA 1.16x10⁻⁵-1.25x10⁻⁵M • Mississippi River, Clinton, IA 7.33x10⁻⁶-9.12x10⁻⁶M
Conclusions • Pike Lake had the highest phosphorus concentration of all the sites. • Based on this study, it can be concluded that the amount of phosphorus in the water decreases as it goes further south.
Experimental Outcomes • An understanding of how to determine the concentration of phosphorous using UV Vis spectroscopy • The technique to analyzing samples • The concentrations of phosphorus in the samples were calculated using Beers Law
Future Outlooks • Test the water during different seasons • Difference in algae blooms • Do testing at different depths in the water • Surface vs. Bottom • Test soil in water sources for phosphorous
Acknowledgements • Loras College • Dr. Carl Binz • Dr. Edward Maslowsky • Professors • Family and Friends
Works Cited • http://www.lenntech.com/periodic/elements/p.htm • http://www.lenntech.com/periodic/elements/n.htm • http://water.epa.gov/type/rsl/monitoring/vms56.cfm • http://sd.lake-link.com/Wisconsin-Lake-Finder/lake.cfm/3955/Pike-Lake-Price-County-Wisconsin • http://dnr.wi.gov/lakes/grants/Project.aspx?project=10100227 • http://linus.chem.ku.edu/hewlett/Chem188/PhosphateLaboratory/procedures%20for%20phosphate%20determination.htm • http://bcn.boulder.co.us/basin/data/NEW/info/TP.html • http://edis.ifas.ufl.edu/ss490 • http://www.water-research.net/Watershed/phosphates.htm • http://www.indigo.com/test_strips/water_testing/33817P-phosphate-levels-test-strips-0-100ppm.html • http://www.mda.state.mn.us/news/publications/chemfert/reports/phosphorusguide.pdf • http://www.organicfacts.net/health-benefits/minerals/health-benefits-of-phosphorus.html • http://www.livestrong.com/phosphorus/