Download
1 / 45
450 likes | 560 Views
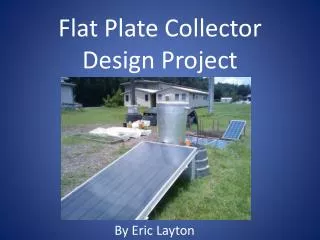
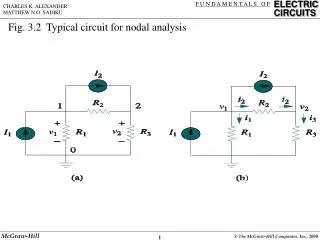
Typical collector design (fig 6.18). Can we understand the design criteria for each of these components?. What happens if you run such a collector too hot?. National Solar Thermal Test Facility—Sandia National Lab. Parabolic collectors. What is this?. http://en.wikipedia.org/wiki/Pump_jack.

E N D
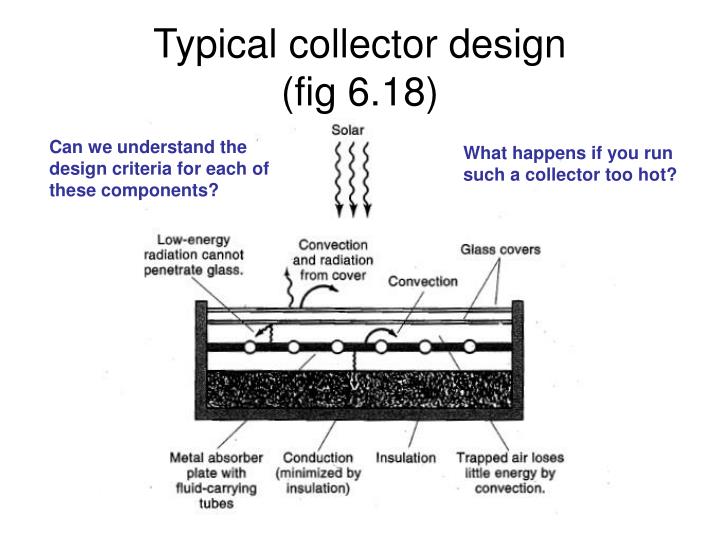
Typical collector design(fig 6.18) Can we understand the design criteria for each of these components? What happens if you run such a collector too hot?
What is this? http://en.wikipedia.org/wiki/Pump_jack
What is oil?? 5-10 carbons/mol. 11-12 carbons/mol. 13-17 carbons/mol. 18-20 C’s/mol. • Complex mixture of MANY different hydrocarbons. More complex molecules (more carbon atoms per molecule) have higher boiling points. • The refining process separates the crude petroleum into many different types of fuels (based on boiling point, and therefore carbon number) • Don’t forget, there are also lots of impurities (sulfur, vanadium, nickel, …).
Resources vs. Reserves(McKelvey Diagram) Reserves Resources
Resources vs. Reserves (McKelvey Diagram) Proven Indicated Inferred Reserves More Expensive Resources More Uncertain
US “Proven Reserves” over the last century (does not include 2006). http://tonto.eia.doe.gov/dnav/pet/pet_sum_crdsnd_adc_mbbl_m.htm
Changes to US Petroleum reserves Note: Domestic “production” accounts for only about 27% of our petroleum consumption
Gasoline prices (EIA) http://www.eia.doe.gov/oil_gas/petroleum/info_glance/petroleum.html
http://www.daviesand.com/Perspectives/Forest_Products/Oil_Reserves/index.htmlhttp://www.daviesand.com/Perspectives/Forest_Products/Oil_Reserves/index.html See also table 7.2 in the text
Oil Reserves http://en.wikipedia.org/wiki/Oil_reserves
Two Views of World’s “Oil” Supply http://www.radford.edu/~wkovarik/oil/
Oil deposits Fig. 7.9 from H&K
Sample seismic section From Lafond et al. CSEG 2004 proceedings (effect of salt domes etc.)
Oil deposits Fig. 7.9 from H&K
Price of Gasoline http://tonto.eia.doe.gov/oog/info/gdu/gasdiesel.asp?featureclicked=4&
How much can you get out? 15% Up to 45% (Total) Even out best technology Presently leaves over half The oil in the ground! 35% (Total)
Model used for the seismic section From Lafond et al. CSEG 2004 proceedings (effect of salt domes etc.)
Tar sands http://www.eos.ubc.ca/research/ubcgif/research/petrol.html
Tar sands- Bucket wheels These devices were used to remove the overburden and remove the Bitumen. The sand was loaded onto 31 MILES of conveyor belt. These Devices were phased out in 2000 in favour of large excavators and trucks. http://www.www.dykon-explosivedemolition.com/Archives/BucketWheel/BucketWheel.html
Tar Sands Each truck carries up to 400 TONS, equivalent of 200 barrels of crude oil (that’s $16K at 80$/bbl).
Tar sands http://www.usask.ca/education/ideas/tplan/sslp/yukon/bitumont.htm
How much can you get out? 15% Up to 45% (Total) Even out best technology Presently leaves over half The oil in the ground! 35% (Total)
Tar sands http://en.wikipedia.org/wiki/Athabasca_Tar_Sands
Other non-conventional resources • Orinoco River basin in Venezuela (about the same size as Alberta’s deposits, easier to extract [they call it extra heavy oil, not bitumen], but politically more complicated). • There are also deposits in the mid-east that are largely ignored due to their proximity to much more easily obtained light oil, but they are approximately a tenth the size of the Alberta and Venezuelan fields.
Oil deposits Fig. 7.9 from H&K
Features of Natural Gas • It is a gas, composed almost entirely of methane (CH4), with some ethane (C2H6) and trace compounds (e.g. to give it an odor). • There are “associated” deposits and “nonassociated” deposits (depending on whether it is found with oil or not) • Expansion of its use required a huge investment in infrastructure (now up to 106 miles of pipe in the system), but as a result use quadrupled from 1950 to 1970. • US consumption is ~22tcf (1tcf= 1 Quad from assignment number 1) and this is about equal to supply right now! • Uses: Space heating/cooking:40%; Industry: 39%; Utility: 18%; transportation: 3%
Typical LNG tankers(Liquified Natural Gas) Puteri Firus (130000 m3) (Alstrom marine, 1997) Classic This larger ships hold roughly the energy equivalent of 600,000 bbl of oil, but it is much more volatile and explosive than oil!
Typical Oil tanker The largest such tankers today can carry up to 2 million barrels of oil (1.2x10¹³ Btu, or about 12 milli-Quads). http://en.wikipedia.org/wiki/Oil_tanker
Quiz 3 • (7 points) Name two of the key features of gasoline that make it particularly attractive as a fuel for transportation?
Coal Today, 90% of US coal consumption is used for Electricity generation. This accounts for 72% of all electricity generation in the U.S. ~13000 Btu/lb 6000 Btu/lb 14000 Btu/lb 9000 Btu/lb Energy content and impurities both change with grade and location.
Coal http://www.mii.org/ReclStories/JacobsRanch/Jacobs.html Underground mining Strip mining (about 60% of today’s production in the U.S.) http://mysite.verizon.net/sosborne1/underground.html
Methane Clathrate Close up of the atomic structure “Burning Ice” http://en.wikipedia.org/wiki/Methane_clathrate
Methane Clathrate http://en.wikipedia.org/wiki/Methane_clathrate