Download
1 / 13
130 likes | 133 Views
Meridional variability of SSS in the North Atlantic Ocean from satellite and in-situ data. J. Ballabrera, N. Hoareau, M. Portabella, E. Garcia-Ladona, A. Turiel SMOS Barcelona Expert Centre Pg. Marítim de la Barceloneta 37-49, Barcelona SPAIN E-mail: mumbert@icm.csic.es. Motivation.

E N D
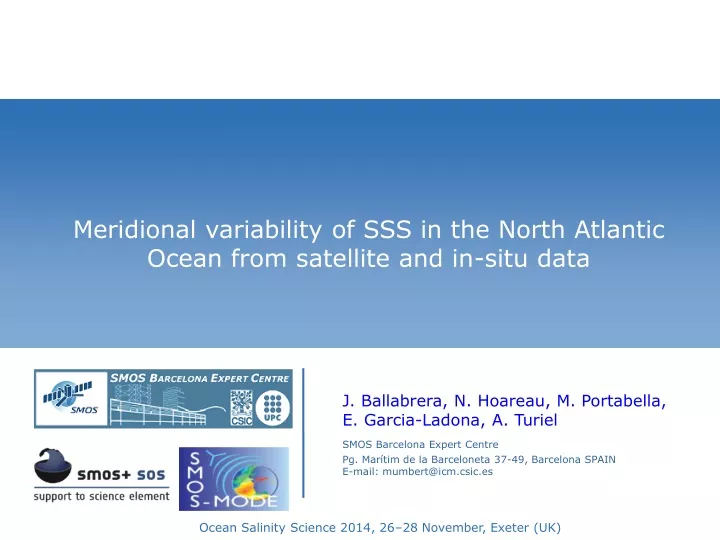
Meridional variability of SSS in the North Atlantic Ocean from satellite and in-situ data J. Ballabrera, N. Hoareau, M. Portabella, E. Garcia-Ladona, A. Turiel SMOS Barcelona Expert Centre Pg. Marítim de la Barceloneta 37-49, Barcelona SPAIN E-mail: mumbert@icm.csic.es
Motivation • To compare the ability of various data sets (a numerical simulation, climatology fields, and various satellite retrievals) to match the meridional structure observed in the in-situ data in the North Atlantic Ocean. • To compare the meridional spectral response of the various data sets to infer information about their relative effective resolution. • Assess the similarities of the Power Density Structure (PDS) of the meridional SSS and SST modulation in the region.
Data • SMOS LEVEL 3 (Binned maps) SSS monthly product at 0.25 degree resolution. • SMOS Optimally Interpolated (OI) SSS monthly product at 0.25 degree resolution. The method uses WOA09 climatology as a background, and spatially varying decorrelation scales. • SMOS LEVEL 4 (Data fusion with OSTIA SST) SSS monthly product at 0.25 degree resolution. The method uses OSTIA SST field as a template to improve the singularity structure of Binned maps. • AQUARIUS LEVEL 3 (v.2.7) 1 degree resolution monthly averaged. • DRAKKAR NATL025 numerical quarter degree numerical simulation. • WOA09 SSS and SST 1 degree climatology fields. Level 0 Level 1 Level 2 Level 3 Level 4
SMOS binned SMOS OI SMOS L4 NATL05 WOA09 AQUARIUS
SMOS binned SMOS OI SMOS L4 NATL05 WOA09 AQUARIUS
SMOS binned SMOS OI SMOS L4 SMOS binned SMOS OI SMOS L4 Mean = -0.54 STD = 0.55 RMS = 0.77 Mean = -0.39 STD = 0.73 RMS = 0.83 Mean = -0.33 STD = 0.53 RMS = 0.62 NATL05 WOA09 AQUARIUS Mean = -1.36 STD = 1.21 RMS = 1.82 Mean = 0.08 STD = 0.38 RMS = 0.39 Mean = -0.02 STD = 0.38 RMS = 0.38
Summary and conclusions • The spectral analysis shows that all six products share a similar slope of about -3 a the largest scales, but they strongly differ at short scales. • Aquarius L3 has a noise floor below 300 km. • SMOS products show a consistent -3 slope, except for the L3 BINNED product which shows an increased noise variance below 700 km. • WOA 09 climatology data display a strong variance decay below 1500 km sales. • Although NATL025 simulation has the worst comparison against in-situ data, it has a large-scale slope of -3 and of -4 below 250 km scales. • NATL025 SSS and SST and OSTIA SSS have similar spectral decay. Large source of uncertainties in resolving salinity still remains. • Further spectral analysis for different regions (zonal) and temporal domains.
SMOS-Mission Oceanographic Data Exploitation SMOS-MODE www.smos-mode.eu info@smos-mode.eu SMOS-MODE supports the network of SMOS ocean-related R&D Final event: 2nd SMOS Science Workshop (Madrid, May 2015)