Download
1 / 21
210 likes | 331 Views
Scenarios Network for Alaska Planning (SNAP). Objectives: Optimize projections of climate change for Alaska Tailor products to needs of stakeholders, planners. Progress to date :. Downscaling of output to 2 km grid for AK; -- coarser output processed for northern Canada

E N D
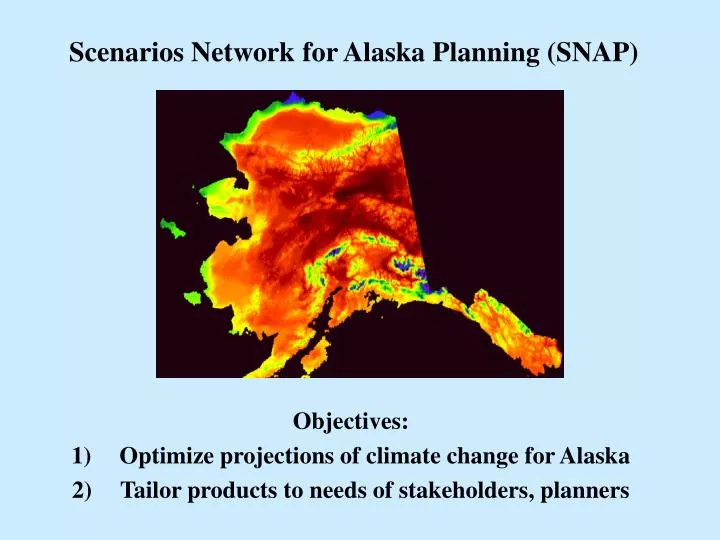
Scenarios Network for Alaska Planning (SNAP) Objectives: Optimize projections of climate change for Alaska Tailor products to needs of stakeholders, planners
Progress to date: Downscaling of output to 2 km grid for AK; -- coarser output processed for northern Canada -- domain recently extended to Beaufort, Chukchi Seas Optimum set of fivemodels identified • Variables: temperature, precipitation, pressure Sea ice output processed from all models (model selection done by Overland and Wang, PMEL)
PRISM July Tmax (1961-1990)(deep red = 70s °F, blue = 40s °F)
Ranking of IPCC AR4 models for Alaska scenarios(Alaska only) Sfc air T SLP Precip Total 1 GFDL CM2.0 (U.S.) 06 04 01 11 2 GFDL CM2.1 (U.S.) 06 05 02 13 3 UKMO HADCM3 (U.K.) 11 04 03 18 4 MPI ECHAM5 (Germany) 13 01 05 19 5 MIROC3.2_MEDRES (Japan) 02 10 07 19 6 MRI CGM2.3.2A (Japan) 11 02 06 19 7 CNRM CM3 (France) 01 07 12 20 8 CCCMA CGCM3.1 (Canada) 12 08 04 24 9 INMCM3.0 (Russia) 07 09 10 26 10 CSIRO MK3.0 (Australia) 05 11 11 27 11 NCAR PCM1 (U.S.) 14 06 08 28 11 IPSL CM4 (France) 11 14 13 28 13 NCAR CCSM3.0 (U.S.) 08 15 09 32 14 GISS MODEL ER (U.S.) 07 12 14 33 15 IAP FGOALS1.0.G (China) 15 13 15 43
If the N models with the smallest RMSE are selected:(temperature, 60-90N)
Projected change of surface air temperature (C), 2040-2059(autumn (SON) winter (DJF)
Projected change of precipitation (cm/mo), 2040-2059winter (DJF) summer (JJA)
Projected change of sea level pressure (mb), winter (DJF)2040-2059 2070-2089
Sample of downscaled projections (A1B scenario):Fort Yukon temperatures by decade FORT-YUKON 66.5647 66.5681 214.7261 214.7170 0.520 KM JAN FEB MAR APR MAY JUN JUL AUG SEP OCT NOV DEC ---------------------------------------------------------------------------------------------------------------------------------------------------------------------- 1961-1990 -20.3 ( 0.0) -15.0 ( 0.0) 0.6 ( 0.0) 21.5 ( 0.0) 45.0 ( 0.0) 60.3 ( 0.0) 63.2 ( 0.0) 56.5 ( 0.0) 41.3 ( 0.0) 19.0 ( 0.0) -7.3 ( 0.0) -18.0 ( 0.0) 1991-2000 -17.9 ( 3.5) -13.7 ( 1.2) 4.9 ( 2.1) 23.6 ( 3.3) 46.2 ( 1.4) 61.1 ( 1.3) 63.8 ( 0.7) 58.1 ( 0.4) 42.1 ( 1.1) 19.8 ( 0.9) -5.2 ( 1.8) -16.6 ( 2.8) 2001-2010 -16.4 ( 3.2) -11.2 ( 3.7) 4.0 ( 1.6) 24.5 ( 2.1) 47.3 ( 1.9) 60.7 ( 1.3) 64.8 ( 1.7) 58.2 ( 1.0) 42.3 ( 1.0) 21.0 ( 1.7) -4.2 ( 1.5) -16.8 ( 2.3) 2011-2020 -16.0 ( 3.3) -11.6 ( 2.3) 3.8 ( 4.0) 24.1 ( 2.1) 46.6 ( 0.9) 62.1 ( 1.3) 63.3 ( 1.5) 58.0 ( 1.1) 43.1 ( 1.0) 20.3 ( 2.1) -4.6 ( 1.3) -15.4 ( 2.0) 2021-2030 -12.9 ( 5.4) -7.2 ( 3.6) 6.0 ( 2.3) 25.0 ( 3.2) 46.8 ( 0.6) 61.7 ( 1.5) 63.8 ( 1.7) 58.7 ( 1.8) 42.5 ( 1.1) 21.7 ( 2.4) -3.9 ( 1.8) -13.4 ( 2.9) 2031-2040 -13.3 ( 1.5) -9.2 ( 4.5) 5.8 ( 4.1) 25.9 ( 2.6) 47.5 ( 1.5) 62.3 ( 1.3) 65.1 ( 2.5) 59.3 ( 2.0) 43.4 ( 1.4) 23.5 ( 2.4) -0.1 ( 1.7) -12.9 ( 2.4) 2041-2050 -10.9 ( 3.5) -6.8 ( 3.7) 11.1 ( 3.2) 25.6 ( 3.0) 48.8 ( 2.1) 63.0 ( 1.9) 66.0 ( 1.7) 60.1 ( 1.5) 45.5 ( 2.1) 26.0 ( 2.0) 2.3 ( 1.5) -9.3 ( 2.8) 2051-2060 -10.9 ( 4.3) -4.5 ( 6.4) 7.5 ( 2.4) 27.2 ( 3.2) 48.4 ( 0.8) 63.8 ( 1.8) 66.5 ( 1.7) 60.5 ( 2.0) 45.1 ( 1.7) 25.4 ( 1.4) 1.8 ( 1.0) -7.1 ( 2.1) 2061-2070 -6.8 ( 2.0) -3.8 ( 3.6) 10.4 ( 4.2) 29.3 ( 3.1) 50.9 ( 2.5) 64.4 ( 3.4) 67.3 ( 3.1) 61.5 ( 2.3) 46.2 ( 2.4) 27.3 ( 2.1) 5.2 ( 3.1) -6.0 ( 4.6) 2071-2080 - 6.4 ( 1.9) -3.4 ( 3.9) 10.8 ( 2.0) 29.3 ( 3.8) 51.3 ( 3.0) 64.3 ( 3.6) 67.7 ( 3.2) 62.7 ( 2.4) 46.9 ( 1.7) 27.8 ( 2.7) 5.3 ( 3.7) -4.3 ( 3.9) 2081-2090 -3.8 ( 1.6) -0.6 ( 3.3) 11.4 ( 3.6) 30.4 ( 3.6) 51.5 ( 2.3) 65.4 ( 3.5) 68.3 ( 2.2) 63.2 ( 2.6) 46.8 ( 1.7) 29.0 ( 1.2) 7.2 ( 2.6) -2.7 ( 3.8) 2091-2100 -5.0 ( 2.9) -1.6 ( 3.7) 13.4 ( 3.1) 31.5 ( 3.5) 52.7 ( 2.3) 65.2 ( 3.5) 69.0 ( 4.4) 63.4 ( 3.4) 48.4 ( 2.1) 28.9 ( 2.4) 7.1 ( 2.2) -0.1 ( 3.0)
Projected temperature change: Nome, AK(skill-weighted, from five best models)
Change of break-up date, Mackenzie River, by 2046-2055(MIROC model)
Change of break-up date, Mackenzie River, by 2091-2100(MIROC model)
Ongoing work • Extension to snowfall/depth, wind, evapotranspiration • Targeting of particular communities • Greater emphasis on uncertainties, probabilities • Assessment of changes in extremes