Download
1 / 31
310 likes | 403 Views
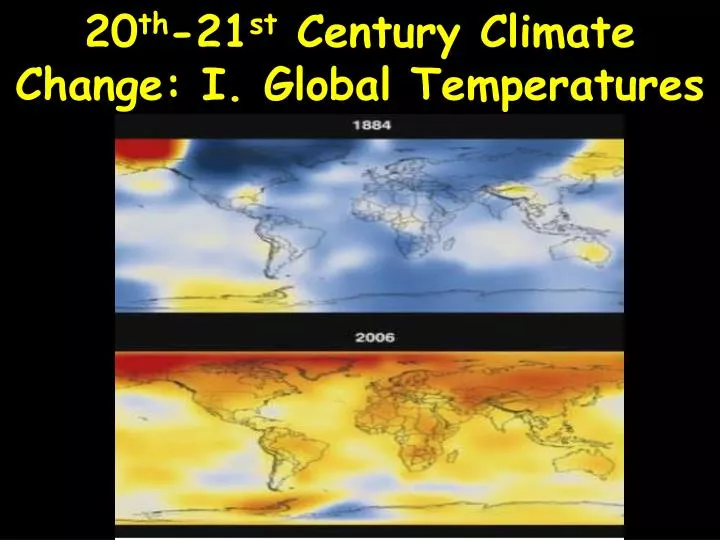
20 th -21 st Century Climate Change: I. Global Temperatures . The Global Temperature Record for the past ~150 Years Can Be Roughly Divided into 4 Regimes. Period #1. Up to ~1912. Human generated GHG’s are still fairly small. Cars are a rarity, human population is a small fraction of today’s.

E N D
The Global Temperature Record for the past ~150 Years Can Be Roughly Divided into 4 Regimes
Period #1. Up to ~1912 • Human generated GHG’s are still fairly small. Cars are a rarity, human population is a small fraction of today’s. • This is still in the general regime of the past interglacial ~6,000 years, which shows little trend in global temperatures • However, an unusually large number of major volcanic eruptions added significant aerosols which cooled global climate: Krakatoa 1883 (climatically strongest in modern record, see especially Gleckler et.al. 2006), Santa Maria(1902, one of the 5 biggest of the past 200 years), Katmai 1912 (largest of the 20th century) • The Katmai eruption set the minimum for global temperatures for the 20th century (and very likely beyond)
Period #2: ~1912 to ~1942 • Solar cycles over the long term show a modulation such that successive solar maxima are roughly similar, and change slowly, over roughly century time scales • Sunspot numbers are a fairly good proxy for solar activity, and recall that there is a 0.1% modulation in the solar luminosity with the solar cycle, and stronger solar cycles are associated with higher solar luminosity • During this period, solar sunspot maxima were trending higher, and the inferred solar luminosity was rising (we have no direct measurements of solar luminosity back in those days) • Climate models show that in addition to rising anthropogenic CO2, solar activity likely contributed to the temperature rise seen at this time (although not much), with deforestation probably being more important. • Also contributing, was a quiet period of no significant volcanic eruptions to inject cooling aerosols, compared to the 1883-1912 period. • See next slide….
Climate modelling (e.g. Hansen 2005) shows increasing solar activity and accompanying luminosity rise likely accounts for a part of 1900-1945 global temperature rise (together with rising CO2 and lower volcanic activity). Radiative forcing amount is not shown on these graphs.
Period #3: WWII to ~1970 • Post WWII period of rapid rebuilding, industrialization • While CO2 levels are rising, they are not rising as fast in this period. And, what is rising faster is the pollution aerosols associated with coal burning, rising vehicle-miles, and power plants. • Unburned hydrocarbons, catalyzed by sunlight and water, combine with sulfates to produce hydrosulfuric acid droplets and other particles which reflect incoming sunlight and cool the surface. • The so-called “aerosol indirect effect” - These particles are also large enough to act as cloud nucleation sites and increase low clouds since this air pollution usually hangs low to the ground due to temperature inversions. Low clouds, recall, generally cool Earth surface temperatures • (I grew up in L.A. in this period. You youngsters cannot believe how bad it was back then. You were lucky to be able to see 2 miles, and seeing the San Gabriel Mountains 20 miles away was a rarity.
More Man-made Pollution, Less Sunlight hits the Ground • At the same time, World War II destroyed a lot of life and industrial capability, and it took some time for this to be rebuilt. So there was a period of reduced growth in greenhouse gases at the beginning of this period, as the CO2 curve shown before shows. • Also, the rising solar luminosity (as inferred from the sunspot cycle) came to a top in the mid 1950’s and has been declining slowly ever since. • By later in this period (’60’s) much higher anthropogenic reflective sulfate smog and a halt in solar luminosity increase was enough to counterbalance CO2-induced global warming and keep temperatures roughly constant
Smog Particles –from R. Healy (looks like a couple of pollen grains (rounded) at upper left as well)
And too: 1945-1975 – A Cool Period in the Pacific Decadal Oscillation • The Pacific Decadal Oscillation (PDO) is a relatively long term oscillation in the heat transport going from the shallow to the deep Pacific ocean. • When heat is transporting from shallow to deep levels, the shallow surface waters tend to be cooler (another way to think of it, is that the upwelling of colder waters is being more effective). • Colder surface waters tend to pull heat transport from the atmosphere to the ocean, and, other things being equal, would correspond to cooler global air temperatures. • The Pacific is large, and this oscillation between relatively warmer and cooler surface waters is irregular but of order a decade or so… • Note the following slide – the mid-century halt in global warming corresponds to a cool period in the PDO.
The PDO Index for the past century. If somehow the PDO, not GHG’s, were responsible for rising global temperatures, you’d expect to see a forcing pattern – the PDO pulling down global temperatures during the past 60 years. In fact, during the past ~25 years the PDO has been weakening and is now in the “low” phase, yet global temperatures have continued upward
Period #4. ~1970 to Today • The Clean Air Actof 1970 and other air pollution laws in the U.S. and Europe cause a significant reduction in cooling aerosols, while China and Asia make up for these improvements with large post-Mao industrialization, largely coal-fired. Net global aerosol effect is approximately a wash, as can be seen in Hansen et al. 2005 (later this slide set) • Greenhouse gas emissions accelerate • Solar and other effects are negligible compared to greenhouse gas emissions, primarily CO2 from oil, gas, gasoline, and coal burning • Strong and accelerating human-caused greenhouse warming dominates climate forcings
14 sec video – Worldwide Temps 1976-2012 • https://www.youtube.com/watch?feature=player_embedded&v=ZAp1o-669xc
Heating and Cooling Forcings to the Earth’s Heat Budget (from Hansen et.al. 2005). Forcings calibrated from observations. Combined with the GISS Climate Model, they reproduce observed global temperature in detail very well. See next slide
Bottom Line: the Two Biggest Climate Forcings: Both are Human-Caused • #1 is greenhouse gases. Primarily CO2, but also some from nitrous oxides and as climate warms, increasing water vapor as well. This forcing WARMS climate • #2 is reflective aerosols from human-caused industrial emissions. These both reduce sunlight to the ground, and also increase low cloudiness. Both effects COOL climate, but not nearly as much as #1 greenhouse gases WARM climate
Real vs. Climate Model Temperatures: (from Hansen et al. 2005) Before 1900, the observed curve is based on observations at meteorological stations and the model is sampled at the same points, whereas after 1900 the observations include sea surface temperatures for the ocean area, and the model is the true global mean (Hansen et al. 2001). Near perfect match!
Notes on Climate Forcings from Hansen et. al. 2005 *Effective forcings are derived from five-member ensembles of 120-year simulations for each individual forcing and for all forcings acting at once [see (9) and supporting online material]. The sum of individual forcings differs slightly from all forcings acting at once because of nonlinearities in combined forcings and unforced variability in climate simulations. * This is the ozone forcing in our principal IPCC simulations; it decreases from 0.24 to 0.22 W/m2 when the stratospheric ozone change of Randel and Wu (S1) is used * Ozone and black carbon forcings are less than they would be for conventional forcing definitions (11), because their ‘‘efficacy’’ is only 75% (9)
IPCC AR4 (2007) Climate Forcings: Human and Natural: Averaged from Pre-industrial 1750 to the present. Note how tiny is solar forcing.
Methane vs. CO2 • Averaged over the ~250 yr Industrial Age, methane provided about ¼ of the heat forcing that CO2 does (there is MUCH less methane in the atmosphere than CO2) • This has been changing rapidly, both from expanding livestock, and recently as Arctic methane trapped in the permafrost is liberated as the last of the Arctic Ocean permanent ice disappears and the albedo effect causes more dramatic warming of the Arctic. • More on Arctic methane later
Let’s Put Recent Global Warming in Context of the Last ~1,000 Years From Mann et.al. 1999. The “Hockey Stick” made famous in “An Inconvenient Truth”
Temperature Proxies for Century, Millenium Time Scales • (See Mann et al. 2008 and here, for more details), but briefly… • Foraminifora: growth sensitive to temperature; different for different species. Preserved in sediments • Tree rings; show good correlation to other proxies, until the 20th century (likely because CO2 levels also affect tree rings and CO2 levels now far above typical values of past 1000 years • Stalagmites: annual growth ring thickness (water from above) sensitive to temperature and climate in general • Ice cores: trapped air bubbles preserve atmosphere, and isotope ratios are sensitive to temperature. Also trap pollen, species sensitive to temperature • Pollen: the mix of plant species is sensitive to Temp. Composition in sediments from lakes, layering showing annual runoff, charcoal shows major fires which can be cross-correlated with other data • Borehole temperatures: surface temperatures conduct downward through the ground, and deep measurements contain information on ancient temperatures. See NOAA’s site on borehole science
Given the importance, the work was re-done with a wider range of temperature proxy assumptions and additional care to avoid statistical over-fitting. Still a Hockey stick. Black=observed. Note the Medieval Warm period is actually a Northern Hemisphere phenomenon, not global.
Glacier length change from temperature proxies: Old photos, and written accounts. Still a hockey stick
Global surface temperature change over the last five centuries from boreholes (thick red line). Shading represents uncertainty. Blue line is a five year running average of HadCRUT global surface air temperature (Huang 2000). Borehole data confirms the other temperature proxies. Still a hockey stick
Jones and Mann (2004) temperature reconstructions using proxies, now going back almost 2000 years, with global temperatures at the bottom pane. Actual instrumental temperatures shown in red. Proxies and instruments both agree - still a Hockey Stick
Key Points: Past 150 years of Global Average Temperature • To 1912: slight cooling due to enhanced volcanic aerosols. Human effects minimal • 1912-1945: Rising temps due to fossil fuels, solar activity, pause in volcanic aerosols • 1945~1970: Flat temps as rising CO2 heating offset by cooling aerosol pollution, helped a bit by low phase of Pacific temps • Since ~1975: Accelerating fossil fuel burning now dominates all other forcings, including cooling due to solar activity, flat to dropping PDO. Also, Clean Air Act reduces aerosol cooling • Avg’d since 1750, CO2 dominates, methane ¼ as much. Human activities dominate over all other forcings, and human heating (CO2) dominates over air pollution aerosol cooling • Temperatures today are higher than any time in human history