Download
1 / 14
140 likes | 149 Views
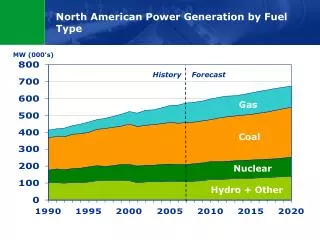
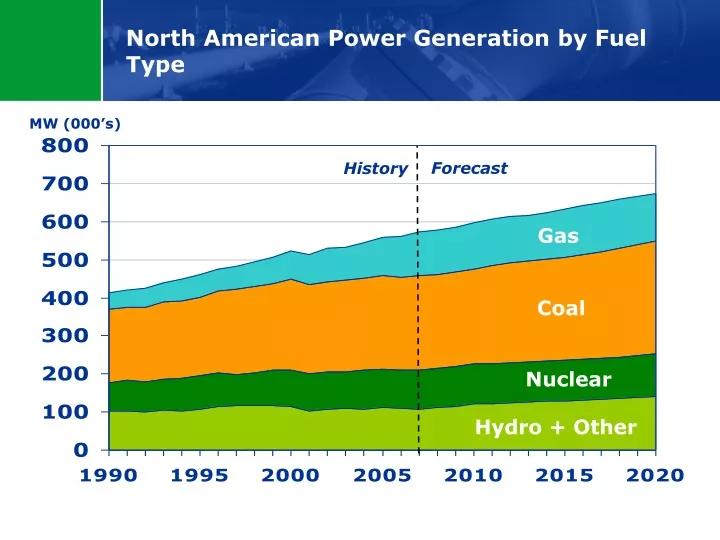
North American Power Generation by Fuel Type. MW (000’s). Forecast. History. Gas. Coal. Nuclear. Hydro + Other. Power Assets. 19 plants 10,900 MW Diversified portfolio primarily consists of low-cost, baseload generation. MacKay River. Bear Creek. Sundance A&B. Redwater.

E N D
North American Power Generation by Fuel Type MW (000’s) Forecast History Gas Coal Nuclear Hydro + Other
Power Assets • 19 plants • 10,900 MW • Diversified portfolio primarily consists of low-cost, baseload generation MacKay River Bear Creek Sundance A&B Redwater Cartier Wind Sheerness Grandview Carseland Kibby Wind Bécancour Cancarb Portlands TC Hydro Halton Hills Gas (52%) Nuclear (23%) Coal (15%) Hydro (5%) Wind (5%) Ocean State Bruce Power Ravenswood Coolidge
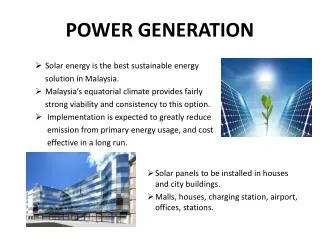
Portlands Energy Centre • A high-efficiency 550 MW combined cycle natural gas-fired generation facility to deliver 25% of central Toronto’s energy needs • Schedule: • 2006 • Construction began • 2008 • 340 MW simple cycle started on time in late May 2008 • Construction of combined cycle facility • 2009 • 550 MW combined cycle facility to be in service Q1/09
Halton Hills • A state of the art 683 MW combined cycle facility with low emissions technology will bring greater stability to GTA West • Schedule: • 2006 - 2007 • Field studies and permitting • Engineering and procurement • 2008 • Construction began • 2010 • 683 MW in service
Ravenswood Generating Station • 2,480 MW facility • US$2.8 billion, 100% TransCanada • High quality asset in a critical market region • Platform for future growth through expansions and re-powering Montréal Boston Toronto Ravenswood New York
Bruce Power • TransCanada’s interest • 48.7% in Bruce A • 31.6% in Bruce B • Long-term agreement with OPA to: • restart Units A1 & A2 • refurbish Units A3 & A4 • TransCanada to invest approx. $3 billion Montréal Bruce Power Boston Toronto New York Bruce A and Bruce B - Units 3-8 produce 4,700 MW - Units 1-2 will add 1,500 MW
Greenhouse Gas Emissions by Sector (2006) % of Total GHG Emissions (CO2e) Commercial/Other Residential Agricultural Electricity Oil & Gas Transportation
Energy sector challenges Energy supply Energy transmission Demand side management Maturity of conventional gas . . . and the emergence of unconventional gas Public demands: lower prices, less greenhouse gas Public interest vs NIMBY, NUMBY, NAMBY, NIMEY, … Economic impact New infrastructure GHG compliance North America’s Energy Infrastructure Challenge
North American Energy Infrastructure Investment Over $5.3 Trillion US$ from 2007-2030 Billion Real 2007 $US Annual Average 2007-2030 $44 $73 $115 $232 Source: IEA World Energy Outlook 2008, Nov 2008 Reference Scenario
North America’s Energy Infrastructure Challenge Regulatory Process Burden Cannot Get Anything Done Appropriate and Cost Effective Very Little Onerous and Expensive
Mackenzie Valley Pipeline Cost Overruns $Millions 3,600 1,600 800 100 Protracted MVP Regulatory Process Comparable Project Regulatory Cost Cost of Capital on Regulatory Costs Inflation During Expected Delay Period Aggregate Impact on MVP Regulatory Process
Thank you Hal KvislePresident and CEOTransCanada Corporation