Download
1 / 12
130 likes | 332 Views
Clinical Outcomes of Intrastromal Corneal Ring Implantation using Femtosecond Laser. Maria Clara Arbelaez, MD No financial interest. Purpose. Methods. Improvement in vision is based on the Visual Acuity Conversion Chart as recommended by Holladay JT Visual acuity measurements.

E N D
Clinical Outcomes of Intrastromal Corneal Ring Implantation using Femtosecond Laser Maria Clara Arbelaez, MD No financial interest
Purpose Methods Improvement in vision is based on the Visual Acuity Conversion Chart as recommended by Holladay JT Visual acuity measurements. J Cataract Refract Surg 2004;30:287-290 To report the results of Intrastromal corneal rings segments ( Keraring-Mediphacos) implantation using a LDV (Ziemer) femtosecond Laser on: • Visual Acuity (UCVA and BCVA) • Refractive Outcome • Topographic findings ( keratrom scout) • Corneal wavefront (keratrom scout) • Ocular wavefront ( schwind aberrometer) • Anterior and posterior elevation(Pentacam and Galilei)
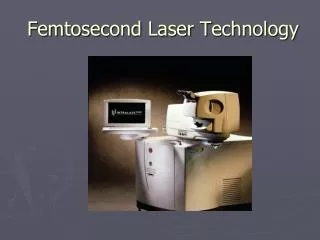
Methods Femto( LDV-Ziemer) with a Hand piece with 450 µm focal depth, following the same principles for flap creation (suction ring, applanation, intrashield), with a top view camera to visualize the trajectory , control shifted trajectory at 25 microns increments and possibility of tunnel customization in wide and arch Intracorneal rings Si5 with internal diameter of 5mm ( Kerarings –Mediphacos), following the manufacture recommended nomogram; using rings of 210, 160,150,120 and 90 degrees and 150, 200,250,300 and 350 microns, on symmetric and asymmetrical placements.
MethodsPOPULATION 70 CASES OF KERATOCONUS, AGE RANGE: 16-44, MEAN : 26.41 1 YEAR POST-OPERATIVE N=19 Sphere -7.00 to +1.75 Mean -1.91 SD 2.38, P=0.016 Cylinder -5.50 to -0.25 Mean -2.14SD 1.25 ,P=0.002 UCVA 0.15 (20/125) to 1.0 ( 20/20) Mean 0.41 (20/50) SD 0.24 BCVA 0.25 ( 20/80) to 1.0 (20/20) Mean 0.66( 20/30) SD 0.23 K average 40.40D to 56.20D Mean 45.94 SD 4.22, P=0.001 K apex 38.36D to 74.62D Mean 47.83D SD 8.75 PRE-OPERATIVE DATA, N=70 Sphere -16 to +2.25 Mean -3.68 SD 3.83 Cylinder -6.00 to -0.25 Mean -3.57 SD1.54 UCVA 0.01 ( CF) to 0.60 ( 20/32) Mean 0.09 ( 20/250) SD 0.12 BCVA 0.15( 20/125) to 1.0 ( 20/20) Mean 0.52 (20/40) SD 0.20 K average 41.2D to 60.18 D Mean 48.29D SD 4.48 K apex 38.79D to 75.25D Mean 49.61 D SD 7.38 6 MONTHS POSTOPERATIVE, N=60 Sphere -9.25 to +3.25 Mean -1.53 SD 2.17, P=0.0006 Cylinder -5.75 to -0.25 Mean -2.26 SD 1.33 UCVA 0.05 (20/400) to 0.9 ( 20/25) Mean 0.42 (20/50) SD 0.20 BCVA 0.2 ( 20/100) to 1.0 (20/20) Mean 0.62( 20/30) SD 0.21 K average 35.90 D to 57.51D Mean 45.64D SD 3.57, P=0.0004 K apex 34.02D to 73.49D Mean 47.77D SD 6.90,P=0.04
CHANGE IN UCVA FROM THE PRE-OPERATIVE TO 6 MONTHS (N=60) CHANGE IN UCVA FROM THE PRE-OPERATIVE TO 1 YEAR (N=19) MEAN CHANGE IN UCVA
CHANGE IN BCVA FROM THE PRE-OPERATIVE TO 6 MONTHS (N=60) CHANGE IN BCVA FROM THE PRE-OPERATIVE TO 1 YEAR (N=19) MEAN CHANGE IN BCVA
CHANGE IN MEAN MANIFEST SPHERE FROM PRE-OPERATIVE TO 3 MONTHS , 6 MONTHS AND 1 YEAR CHANGE IN MEAN MANIFEST CYLINDER FROM PRE-OPERATIVE TO 3 MONTHS , 6 MONTHS AND 1 YEAR There was a statistically significant reduction in the mean manifest sphere from pre-operative value of -3.68 D to –1.40 D at 3 months post-operative (p=0.001), to -1.53 at 6 months post-operative (p=0006), to -1.91 D at 1year post-operative, p=0.016 The mean manifest cylinder changed from a pre-operative value of -3.57 D to -2.31 D at 3 months post-operative, p=0.0004, to -2.26D at 6months post-operative, and to -2.14D at 1 year p=0.002
TOPOGRAPHIC MEASURED CHANGE IN K AVERAGE AT 3 MONTHS, 6 MONTHS AND 1 YEAR TOPOGRAPHIC MEASURED CHANGE IN K MAX AT THE APEX AT 3 MONTHS, 6 MONTHS AND 1 YEAR There was a significant reduction in K average from a pre-operative value of 48.29D to 45.68 at 3 months post-operative, p=0.02, to 45.64D p=0.0004 at 6 months post-operative and 45.94 D at 1 year There was a significant reduction in K max from a pre-operative value of 49.61D to 47.47 D at 3 months post-operative, p=0.01, to 47.77 D at 6 months post-operative, p=0.04 and 47.83 at 1 year post-operative
CHANGE IN ANTERIOR ELEVATION MEASURED BY THE OCULUS PENTACAM AT 3 MONTHS, 6 MONTHS AND 1 YEAR CHANGE IN POSTERIOR ELEVATION MEASURED BY THE OCULUS PENTACAM AT 3 MONTHS, 6 MONTHS AND 1 YEAR There was a significant reduction in the anterior elevation at the thinnest location from a pre-operative value of 28.17µm to 10.45 µm at 3 months post-operative, P=0.0002, to 13.14 µm at 6months and 14.61 µm at 1 year, p=0.03. Significant difference was also found in the anterior elevation at the apex from pre-operative value of 16.74 µm to 7.77 µm at 3 months, p=0.0003, to 8.36 µm at 6months, p=0.001, and 9.22 µm at 1 year, p=0.008 There was a significant reduction in the posterior elevation at the thinnest location from a pre-operative value of 48.36 µm to 33.20 µm at 3 months post-operative, p=0.0002, to 36.72 at 6months, p=0.04 and 37.89 um at 1 year, p=0.06. No significant difference was found in the posterior elevation at the apex from pre-operative value of 26.97 µm to 11.67 µm at 1 year, p>0.05
CORNEAL WAVEFRONT ANALYSIS: COMPARISON BETWEEN PREOPERATIVE VALUE TO 3 MONTHS, 6 MONTHS AND 1 YEAR POST-OPERATIVE OCULAR WAVEFRONT ANALYSIS: COMPARISON BETWEEN PREOPERATIVE VALUE TO 3 MONTHS, 6 MONTHS AND 1 YEAR POST-OPERATIVE There was a significant reduction in coma 3,-1 (P=0.0003) , coma 3,1( p=0.01) and RMS (p=0.003) from pre-operative value to 1 year post-operative There was a significant reduction in coma 3,-1 (P=0.01) and Trefoil 3,3- (p=0.03) from pre-operative value to 1 year post-operative
Conclusion • 98.33 % gain lines on UCVA at 6 months ( n=60 ) , 100 % improved UCVA at 1 year (n=19) • 63.33% improved lines of BCVA at 6 months ( n=60 ), 57.9% gain lines at 1 year (n=19) • There was a statistically significant reduction in the mean manifest sphere from pre-operative value of -3.68 D to –1.40 D at 3 months post-operative (n=45) (p=0.001), to -1.53 at 6 months post-operative (n=60) (p=0006), to -1.91 D at 1year post-operative (n=19)(p=0.016) • The mean manifest cylinder changed from a pre-operative value of -3.57 D to -2.31 D at 3 months post-operative, p=0.0004, to -2.26D at 6months post-operative, and to -2.14D at 1 year p=0.002 • There was a statistically significant reduction in the mean manifest sphere from pre-operative value of -3.68 D to –1.40 D at 3 months post-operative (p=0.001), to -1.53 at 6 months post-operative (p=0006), to -1.91 D at 1year post-operative, p=0.016 • There was a significant reduction in K max from a pre-operative value of 49.61D to 47.47 D at 3 months post-operative, p=0.01, to 47.77 D at 6 months post-operative, p=0.04 and 47.83 at 1 year post-operative • There was a significant reduction in the anterior elevation at the thinnest location from a pre-operative value of 28.17µm to 10.45 µm at 3 months post-operative, P=0.0002, to 13.14 µm at 6months and 14.61 µm at 1 year, p=0.03. • Significant difference was also found in the anterior elevation at the apex from pre-operative value of 16.74 µm to 7.77 µm at 3 months, p=0.0003, to 8.36 µm at 6months, p=0.001, and 9.22 µm at 1 year, p=0.008 • There was a significant reduction in the posterior elevation at the thinnest location from a pre-operative value of 48.36 µm to 33.20 µm at 3 months post-operative, p=0.0002, to 36.72 at 6months, p=0.04 and 37.89 um at 1 year, p=0.06. • No significant difference was found in the posterior elevation at the apex from pre-operative value of 26.97 µm to 11.67 µm at 1 year, p>0.05 • Corneal wavefront aberrations: There was a significant reduction in the coma 3,-1 (P=0.0003) , coma 3,1( p=0.01) and RMS (p=0.003) from pre-operative value to 1 year post-operative • Ocular wavefront aberrations: There was a significant reduction in coma 3,-1 (P=0.01) and Trefoil 3,3- (p=0.03) from pre-operative value to 1 year post-operative
3 m pop: 0.6 +1.25 -1.50 x 66 0.6 3 Months Pre vs Pop Calculation Type I – II -0,25 sphere -5.50 cy l70 Ring 160/250 Axis 160 Depth: 390 microns CLINICAL CASE • Additional video with surgery technique