Download
1 / 39
390 likes | 518 Views
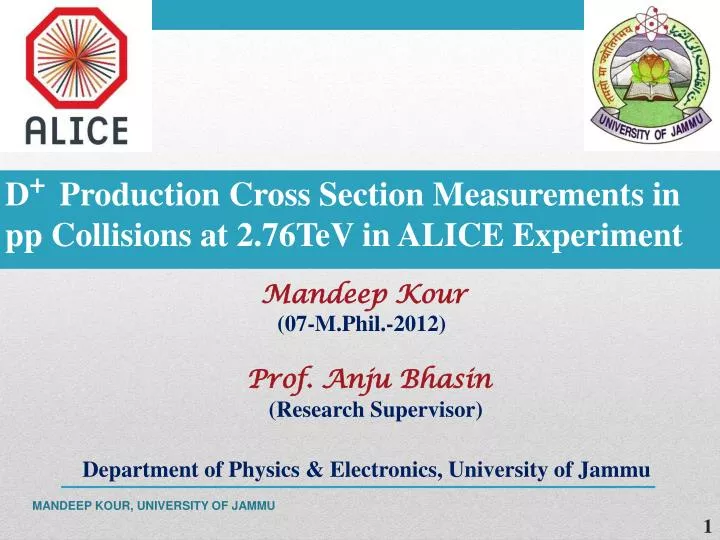
D + Production Cross Section Measurements in pp Collisions at 2.76TeV in ALICE Experiment Mandeep Kour (07-M.Phil.-2012) Prof. Anju Bhasin (Research Supervisor) Department of Physics & Electronics, University of Jammu.

E N D
D+ Production Cross Section Measurements in pp Collisions at 2.76TeV in ALICE Experiment MandeepKour (07-M.Phil.-2012) Prof. AnjuBhasin (Research Supervisor) Department of Physics & Electronics, University of Jammu D+ Production Cross Section Measurements in pp Collisions at 2.76TeV in ALICE Experiment MANDEEP KOUR, UNIVERSITY OF JAMMU
Outline • Motivation • Introduction to Quark Gluon Plasma • Properties of D+ meson • ALICE Detector Layout • Data Sample Used • Analysis Strategy • Results • Dissertation Layout • Summary & Conclusion MANDEEP KOUR, UNIVERSITY OF JAMMU
- - Motivation • Due to their large mass heavy (charm & beauty) quarks are mainly produced at the very beginning of the collision in the scatterings between the partons of the colliding nucleons that are enough energetic to create a pair of heavy partons. The produced heavy quarks travel through the medium experiencing all the stages of the medium evolution and finally hadronize inside or outside the fireball. • Time scale for a cc pair production is ∼ 0.1 fm/c, which is much smaller than the expected lifetime of the Quark Gluon Plasma ∼ 10 fm/c. Thus, heavy quarks are expected to provide information about the hottest initial phase. • Measurement of D mesons can be used to extract the charm production cross section. • Measurement of charm production cross section in pp is an essential requirements in order to have a baseline to perform measurement in Pb-Pb. MANDEEP KOUR, UNIVERSITY OF JAMMU
hadronic phase and freeze-out Quark Gluon Plasma initial state hadronization pre-equilibrium QUARKGLUONPLASMA At extremely High Densities & Temperatures Nuclear Matter may undergo a Phase Transition to a state called the Quark Gluon Plasma (QGP)such conditions can be created in high energy heavy-ion collisions • Signatures of QGP in Experiment • Direct Photon • Strangeness Enhancement • J/ Ψ Suppression • Jet Quenching • Fluctuations and Correlation • Dilepton Production • Heavy Flavour MANDEEP KOUR, UNIVERSITY OF JAMMU
Properties of D+ meson • D+ meson is the lightest meson containing a charm quark and down antiquark. • First charmed particle discovered was the J/ Ψ . • c-quark was simultaneously discovered by two different teams independently in 1974, one at the Brookhaven National Laboratory (BNL) and other at the Stanford Linear accelerator Center (SLAC) • Decay by weak interaction. MANDEEP KOUR, UNIVERSITY OF JAMMU 5
Space time evolution of heavy ion collisions MANDEEP KOUR, UNIVERSITY OF JAMMU 6
LHC Alice Detector Layout TPC and TOF are used for particle identification MANDEEP KOUR, UNIVERSITY OF JAMMU
Data Sample Used Data LHC11a pass3_withoutSDD/AOD067 For MC LHC11b10b AOD046 LHC10f6a AOD041 LHC10d4 AOD056 MANDEEP KOUR, UNIVERSITY OF JAMMU
Analysis Strategy Open heavy-flavours are studied at ALICE in the mid-rapidity region through hadronic decay channels. Open charm particles studied at ALICE: D+, D0, D*, and Ds. For the reconstructed candidates the invariant mass distribution is built and then fitted in the region of the hadron mass value to extract the yields of signal and background. The invariant mass of each candidate is calculated using the following formula (in natural units): To improve the fit results & to maximize the statistical significance, the candidates must pass several analysis cuts. MANDEEP KOUR, UNIVERSITY OF JAMMU
Cut variables Cos(Ѳpoint) Ѳpointis pointing angle b/w the direction of the reconstructed D meson momentum and the line connecting the primary and secondary vertices. If the found vertex really corresponds to a D-meson decay vertex, then Ѳpoint ~ 0 and cos(Ѳpoint) ~ 1 as shown in the fig. Cut variables Cos(Ѳpoint) Ѳpointis pointing angle b/w the direction of the reconstructed D meson momentum and the line connecting the primary and secondary vertices. If the found vertex really corresponds to a D-meson decay vertex, then Ѳpoint ~ 0 and cos(Ѳpoint) ~ 1 as shown in the fig. Cut variables Cos(Ѳpoint) Ѳpointis pointing angle b/w the direction of the reconstructed D meson momentum and the line connecting the primary and secondary vertices. If the found vertex really corresponds to a D-meson decay vertex, then Ѳpoint ~ 0 and cos(Ѳpoint) ~ 1 as shown in the fig. MANDEEP KOUR, UNIVERSITY OF JAMMU
Working point: d>700 mm d cut (mm) Decay Lengthdl; decay length is the distance between the primary and secondary vertices given as: The signal candidates are characterized by larger values of dl according to the fact that they come from displaced decay vertices;
Sum of the squares of the three impact parameters with respect to the primary vertex given as; where d0,i is the distance of closest approach of the track to the primary vertex in the transverse plane . Quality of the found secondary vertex is defined as: Transverse momentum, pT > pTcut & pTcut=0.3Gev/c MANDEEP KOUR, UNIVERSITY OF JAMMU
Invariant Mass Spectrum Fig: Invariant mass spectrum for decay without cuts achieved from Monte Carlo sample of 60 millions minimum bias p-p events
Invariant Mass Spectrum Fig3:Invariant mass spectrum for decay with cuts achieved from Monte Carlo sample of 60 millions minimum bias p-p events
mand the fiducial acceptance Experimental acceptance & reconstruction efficiency Luminosity = 1.1nb-1 Prompt fraction Raw yield BRBranching ratio MANDEEP KOUR, UNIVERSITY OF JAMMU
Results MANDEEP KOUR, UNIVERSITY OF JAMMU
Reference Cut MANDEEP KOUR, UNIVERSITY OF JAMMU
MANDEEP KOUR, UNIVERSITY OF JAMMU Table: Cut values used in Reference Cut
Number of events=58.74M 2<pt<4(GeV/c) 4<pt<6(GeV/c) Fig:Invariant mass spectrum of D+. Entries have been plotted along y-axis and invariant mass (GeV/c2) along x-axis
6<pt<8 (GeV/c) 8<pt<12(GeV/c) Fig:Invariant mass spectrum of D+. Entries have been plotted along y-axis and invariant mass (GeV/c2) along x-axis
Fig: Efficiency vspT Fig: Cross section vspT MANDEEP KOUR, UNIVERSITY OF JAMMU
Cut 1 MANDEEP KOUR, UNIVERSITY OF JAMMU
MANDEEP KOUR, UNIVERSITY OF JAMMU Table:1 cut values used for set2
2<pt<4(GeV/c) 4<pt<6(GeV/c) Fig:Invariant mass spectrum of D+. Entries have been plotted along y-axis and invariant mass (GeV/c2) along x-axis
2<pt<4(GeV/c)4<pt<6(GeV/c) Fig:Invariant mass spectrum of D+. Entries have been plotted along y-axis and invariant mass (GeV/c2) along x-axis
Fig: Cross section vspT Fig: Efficiency vspT MANDEEP KOUR, UNIVERSITY OF JAMMU
Cut 2 MANDEEP KOUR, UNIVERSITY OF JAMMU
MANDEEP KOUR, UNIVERSITY OF JAMMU Table:1 cut values used for set3
2<pt<4(GeV/c)4<pt<6(GeV/c) Fig:Invariant mass spectrum of D+. Entries have been plotted along y-axis and invariant mass (GeV/c2) along x-axis
6<pt<8(GeV/c) 8<pt<12(GeV/c) Fig:Invariant mass spectrum of D+. Entries have been plotted along y-axis and invariant mass (GeV/c2) along x-axis
Fig: Efficiency vspT Fig: Cross section vspT MANDEEP KOUR, UNIVERSITY OF JAMMU
Fig: Cross section vs pT for three different cuts MANDEEP KOUR, UNIVERSITY OF JAMMU
Comparison of cross section calculated from Cut2and Cut3 with Cut 1 cross section of D+ in different pTintervals. MANDEEP KOUR, UNIVERSITY OF JAMMU
From mc 2<pt<4(GeV/c)4<pt<6(GeV/c) Fig:Invariant mass spectrum of D+. Entries have been plotted along y-axis and invariant mass (GeV/c2) along x-axis
6<pt<8(GeV/c) 8<pt<12(GeV/c) Fig:Invariant mass spectrum of D+. Entries have been plotted along y-axis and invariant mass (GeV/c2) along x-axis
Fig: Comparison of Mean vspT from cut1, cut2 and published cut with MC Fig: Comparison of Sigma vspT from cut1, cut2 and published cut with MC MANDEEP KOUR, UNIVERSITY OF JAMMU
Summary & Conclusion Cut optimization done in three sets for D+ signal in different pt intervals. Cross section calculated for these sets . Cross section is compared for the three different sets and found to be compatible within the error. Cross section is pT dependent and Cut values independent. MANDEEP KOUR, UNIVERSITY OF JAMMU
Chapter 1 Heavy ion Physics • Chapter2 LHC and ALICE Detector • Chapter3 D meson Cross section studies • Chapter 4 Analysis and Results M.Phil dissertation Layout MANDEEP KOUR, UNIVERSITY OF JAMMU
THANKS… MANDEEP KOUR, UNIVERSITY OF JAMMU