Download
1 / 32
320 likes | 522 Views
ET2050 European Territorial Scenarios modelled by SASI. Klaus Spiekermann and Michael Wegener ESPON 2013 Programme Workshop Territorial Vision for Europe towards 2050 Brussels, 11 October 2013. The SASI Model. The SASI model. The SASI model is a recursive-dynamic simulation

E N D
ET2050European Territorial Scenariosmodelled by SASI Klaus Spiekermann and Michael Wegener ESPON 2013 Programme Workshop Territorial Vision for Europe towards 2050 Brussels, 11 October 2013
The SASI model The SASI model is a recursive-dynamicsimulation model of socioeconomic development of regions in Europe under assumptions about • European economic development and external net migration, • European transport policies (TEN-T), • regional subsidies (ERDF, EAFRD, ESF, CF). The SASI model differs from other regional economic models by modelling not only production (the demand side of regional labour markets) but also population (the supply side of labour markets) and travel and freight transport flows.
Transfer policies Transport policies Production function Migration function Accessibility Population GDP Income Unemploy ment Labour force Employment SASI model
Questions answered in ET2050 How will different spatial orientations of European • infrastructure investments (TEN-T) • regional subsidies (ERDF, EAFRD, ESF, CF) affect • regional economic development, • regional population/migration, • interregional travel and freight flows, • territorial cohesion and polycentricity, • energy consumption/CO2 emissions?
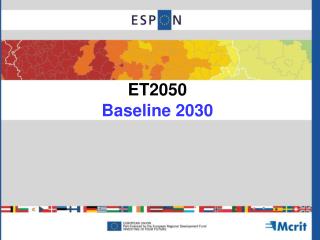
Baseline Scenario The Baseline Scenario for 2030 and 2050 is based on BAU assumptions about • European economic development, • European net migration, • European regional subsidies, • European transport policies. and produces forecasts of: • regional economic development, • regional population/migration, • interregional travel and goods flows, • energy consumption/CO2 emissions, • territorial cohesion and polycentricity.
Exploratory Scenarios The definition of the SASI exploratory scenarios is based on the same region typology as used by the MASST and MULTIPOLES models but translated into NUTS-3 regions: • In the MEGAs Scenario A large European metro-politan areas are promoted in the interest of com-petitiveness and economic growth. • In the Cities Scenario B major European cities are promoted in order to strengthen the balanced poly-centric spatial structure of the European territory. • In the Regions Scenario C rural and peripheral regions are promoted to advance territorial cohesion between affluent and economically lagging regions.
Exploratory Scenarios In the SASI exploratory scenarios A, B and C the assumptions about total European development and European net migration remain the same as in the Baseline Scenario. However, the exploratory scenarios differ in their assumptions about • the allocation of EU Structural Funds subsidies (see next slide), • European transport policies (see three following slides).
Exploratory scenarios: Structural Funds A (MEGAs) B (Cities) C (Regions) 1.0 % 0.5 0.25% of total EU Structural Funds Baseline Scenario The
Scenario A: Network improvements (if necessary) MEGA Connections between MEGAs not more than 500 km apart. Minimum speed: Road: 90 km/h Rail: 200 km/h
Scenario B: Network improvements (if necessary) City Baseline Scenario Connections between cities not more than 300 km apart. Minimum speed: Road: 80 km/h Rail: 160 km/h
Scenario C: Network improvements (if necessary) Region Baseline Scenario Connections between regions and MEGAs/Cities not more than 200 km apart. Minimum speed: Road: 65 km/h Rail: 80 km/h
Baseline Scenario: Accessibility travel road/rail 2036 Baseline Scenario: Accessibility travel road/rail 1981 Baseline Scenario: Accessibility travel road/rail 1986 Baseline Scenario: Accessibility travel road/rail 1991 Baseline Scenario: Accessibility travel road/rail 1996 Baseline Scenario: Accessibility travel road/rail 2001 Baseline Scenario: Accessibility travel road/rail 2006 Baseline Scenario: Accessibility travel road/rail 2011 Baseline Scenario: Accessibility travel road/rail 2016 Baseline Scenario: Accessibility travel road/rail 2021 Baseline Scenario: Accessibility travel road/rail 2026 Baseline Scenario: Accessibility travel road/rail 2031 Baseline Scenario: Accessibility travel road/rail 2041 Baseline Scenario: Accessibility travel road/rail 2046 Baseline Scenario: Accessibility travel road/rail 2051
Baseline Scenario: GDP per capita 2051 GDP per capita (1000 € of 2010)
Scenario A: GDP per capita Difference to Baseline Scenario 2051 Difference to Baseline Scenario (%) 2051
Scenario B: GDP per capita Difference to Baseline Scenario 2051 Difference to Baseline Scenario (%) 2051
Scenario C: GDP per capita Difference to Baseline Scenario 2051 Difference to Baseline Scenario (%) 2051
Scenario variants In addition, the Baseline Scenario and the exploratory scenarios A, B and C are combined with alternative framework conditions: Economic decline. Globalisation will lead to stagnation and almost decline of the European economy (only +0.62 % GDP growth p.a.) Technology advance. Innovations will result in sig-nificant growth in labour productivity (+1.94 % p.a.) and energy efficiency of transport (+0.75 % p.a.). Energy/climate. Rising energy costs and/or green-house gas emission taxes will lead to strong growth of production and transport costs (+5 % p.a.).
Scenario variants The combination of the exploratoy scenarios and the variants leads to nine additional scenarios:
Scenario comparison Remaining East-West gap: GDP per capita EU15/EU12 (1,000 Euro of 2010) 1981-2051
Scenario comparison Declining overall regional disparities: Gini coefficient of GDP per capita 1981-2051
Scenario comparison Dynamic urban structures in EU12: National polycentricity index 1981-2051
Scenario comparison Increase in energy efficiency & share of renewable energy: CO2 emission by transport per capita p.a. (t) 1981-2051
Conclusions The comparison of scenarios with respect to the three major EU goals gives a straightforward result: • Competitiveness: The A scenarios (MEGAs) produce the largest growth in GDP. The C scenarios (Regions) perform worst in terms of overall economic growth. The B scenarios (Cities) lie in between. • Cohesion: The C scenarios perform best in terms of cohesion and polycentricity. The A scenarios slow the convergence down. The B scenarios lie in between. • Sustainability: The B scenarios are most successful environmentally. The A and C scenarios use more energy and emit more CO2 for transport.
Conclusions The results of the scenario simulations with the SASI model can be summarised as follows: • Promotion of metropolitan areas will maximise economic growth but increase spatial disparities and environmental damage. • Promotion of rural and peripheral regions will increase spatial cohesion but reduce economic growth and sustainability. • Promotion of large and medium-sized cities is a rational trade-off between competitiveness and cohesion and will be best for the environment.
Conclusions These results validate the balanced polycentric spatial organisation of Europe as suggested by the European Spatial Development Perspective (ESDP) and the Territorial Agenda (TA). The B scenarios (Cities) should therefore be taken as the point of departure for the territorial vision.
More information Wegener, M., Bökemann, D. (1998): SASI Model: Model Structure. Berichte aus dem Institut für Raumplanung 40. Dortmund: Institute of Spatial Planning, University of Dortmund. http://www.raumplanung.unidortmund.de/irpud/fileadmin/irpud/content/documents/publications/ber40.pdf. Wegener, M. (2008): SASI Model Description. Working Paper 08/01. Dortmund: Spiekermann & Wegener Stadt und Regionalforschung. http://www.spiekermann-wegener.de/mod/pdf/AP_0801.pdf. Spiekermann, K. Wegener, M. (2013): The SASI Sce-narios until 2050. Project Report for the ESPON-Projekt ET2050 (Territorial Scenarios and Visions for Europe).