Download
1 / 19
190 likes | 360 Views
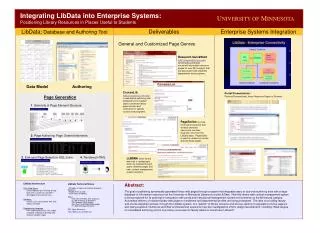
Intelligent Icons: Integrating Lite-Weight Data Mining and Visualization into GUI Operating Systems. Eamonn Keogh Li Wei Xiaopeng Xi Stefano Lonardi Jin Shieh Scott Sirowy Computer Science & Engineering Dept. University of California – Riverside. Outline. Overview

E N D
Intelligent Icons: Integrating Lite-Weight Data Mining and Visualization into GUI Operating Systems Eamonn Keogh Li Wei Xiaopeng Xi Stefano Lonardi Jin Shieh Scott Sirowy Computer Science & Engineering Dept.University of California – Riverside
Outline • Overview • An Example: DNA to Intelligent Icon • Icon Generation Algorithm • Experimental Evaluation • Conclusion Eamonn, patent this idea! Christos Faloutsos
Dataset Kalpakis_ECG Icons in a traditional browser
normal9.txt normal8.txt normal5.txt normal1.txt normal10.txt normal11.txt normal15.txt normal14.txt normal13.txt normal7.txt normal2.txt normal16.txt normal18.txt normal12.txt normal4.txt normal3.txt normal17.txt normal6.txt Dataset Kalpakis_ECG • Suppose I magically.. • Color the icons to somehow reflect the contents of the file. • Position the icons based on their colors/patterns
TGGCCGTGCTAGGCCCCACCCCTACCTTGCAGTCCCCGCAAGCTCATCTGCGCGAACCAGAACGCCCACCACCCTTGGGTTGAAATTAAGGAGGCGGTTGGCAGCTTCCCAGGCGCACGTACCTGCGAATAAATAACTGTCCGCACAAGGAGCCCGACGATAGTCGACCCTCTCTAGTCACGACCTACACACAGAACCTGTGCTAGACGCCATGAGATAAGCTAACACAAAAACATTTCCCACTACTGCTGCCCGCGGGCTACCGGCCACCCCTGGCTCAGCCTGGCGAAGCCGCCCTTCATGGCCGTGCTAGGCCCCACCCCTACCTTGCAGTCCCCGCAAGCTCATCTGCGCGAACCAGAACGCCCACCACCCTTGGGTTGAAATTAAGGAGGCGGTTGGCAGCTTCCCAGGCGCACGTACCTGCGAATAAATAACTGTCCGCACAAGGAGCCCGACGATAGTCGACCCTCTCTAGTCACGACCTACACACAGAACCTGTGCTAGACGCCATGAGATAAGCTAACACAAAAACATTTCCCACTACTGCTGCCCGCGGGCTACCGGCCACCCCTGGCTCAGCCTGGCGAAGCCGCCCTTCA Let us start with visualizing a special data type, DNA. The DNA of two species… Are they similar? CCGTGCTAGGGCCACCTACCTTGGTCCGCCGCAAGCTCATCTGCGCGAACCAGAACGCCACCACCTTGGGTTGAAATTAAGGAGGCGGTTGGCAGCTTCCAGGCGCACGTACCTGCGAATAAATAACTGTCCGCACAAGGAGCCGACGATAAAGAAGAGAGTCGACCTCTCTAGTCACGACCTACACACAGAACCTGTGCTAGACGCCATGAGATAAGCTAACA
C T A G C C C C C T T T T T A A A A A G G G G G 0.20 0.24 CCGTGCTAGGGCCACCTACCTTGGTCCGCCGCAAGCTCATCTGCGCGAACCAGAACGCCACCACCTTGGGTTGAAATTAAGGAGGCGGTTGGCAGCTTCCAGGCGCACGTACCTGCGAATAAATAACTGTCCGCACAAGGAGCCGACGATAAAGAAGAGAGTCGACCTCTCTAGTCACGACCTACACACAGAACCTGTGCTAGACGCCATGAGATAAGCTAACA 0.26 0.30
CC CC CC CT CT CT TC TC TC TT TT TT C T CA CA CA CG CG CG TA TA TA TC TC TC AC AC AC AT AT AT GC GC GC GT GT GT A G AA AA AA AG AG AG GA GA GA GG GG GG CC CCC CCC CCC CCC CCT CCT CCT CCT CTC CTC CTC CTC CC CC CC CC CC CC CC CT CT CT CT CT CT CT CT TC TC TC TC TC TC TC TC TT TT TT TT TT TT TT TT C C C C C C T T T T T T CCA CCA CCA CCA CCG CCG CCG CCG CTA CTA CTA CTA CAC CAC CAC CAC CAT CAT CAT CAT CA CA CA CA CA CA CA CA CG CG CG CG CG CG CG CG TA TA TA TA TA TA TA TA TC TC TG TC TG TC TC TC CAA CAA CAA CAA AC AC AC AC AC AC AC AC AT AT AT AT AT AT AT AT GC GC GC GC GC GC GC GC GT GT GT GT GT GT GT GT A A A A A A G G G G G G AA AA AA AA AA AA AA AA AG AG AG AG AG AG AG AG GA GA GA GA GA GA GA GA GG GG GG GG GG GG GG GG CCGTGCTAGGGCCACCTACCTTGGTCCGCCGCAAGCTCATCTGCGCGAACCAGAACGCCACCACCTTGGGTTGAAATTAAGGAGGCGGTTGGCAGCTTCCAGGCGCACGTACCTGCGAATAAATAACTGTCCGCACAAGGAGCCGACGATAAAGAAGAGAGTCGACCTCTCTAGTCACGACCTACACACAGAACCTGTGCTAGACGCCATGAGATAAGCTAACA
0.04 0.02 0.04 0.09 1 0.02 0.07 0.03 CA CA CA CA CA CA CA CA CA CA 0.03 0.11 AC AC AC AC AC AC AC AC AC AC AT AT AT AT AT AT AT AT AT AT AA AA AA AA AA AA AA AA AA AA AG AG AG AG AG AG AG AG AG AG CCGTGCTAGGCCCCACCCCTACCTTGCAGTCCCCGCAAGCTCATCTGCGCGAACCAGAACGCCCACCACCCTTGGGTTGAAATTAAGGAGGCGGTTGGCAGCTTCCCAGGCGCACGTACCTGCGAATAAATAACTGTCCGCACAAGGAGCCCGACGATAGTCGACCCTCTCTAGTCACGACCTACACACAGAACCTGTGCTAGACGCCATGAGATAAGCTAACA 0
OK. Given any DNA string I can make a colored bitmap, so what? CCGTGCTAGGCCCCACCCCTACCTTGCAGTCCCCGCAAGCTCATCTGCGCGAACCAGAACGCCCACCACCCTTGGGTTGAAATTAAGGAGGCGGTTGGCAGCTTCCCAGGCGCACGTACCTGCGAATAAATAACTGTCCGCACAAGGAGCCCGACGATAGTCGACCCTCTCTAGTCACGACCTACACACAGAACCTGTGCTAGACGCCATGAGATAAGCTAACA
Indian rhinoceros.dna white rhinoceros.dna rhesus monkey.dna pygmy chimpanzee.dna sperm whale.dna Indian hippopotamus.dna chimpanzee.dna elephant.dna Human.dna African orangutan.dna elephant.dna pygmy sperm whale.dna Indian Indian rhinoceros.dna rhinoceros.dna white white rhinoceros.dna rhesus rhesus monkey.dna monkey.dna pygmy pygmy chimpanzee.dna chimpanzee.dna sperm sperm whale.dna whale.dna Indian Indian hippopotamus.dna hippopotamus.dna chimpanzee.dna chimpanzee.dna elephant.dna elephant.dna Human.dna Human.dna African African orangutan.dna orangutan.dna elephant.dna elephant.dna pygmy pygmy sperm whale.dna sperm whale.dna
Note Elephas maximus is the Indian Elephant, Loxodonta africana is the African elephant and Pan troglodytes is the chimpanzee.
aa ac ca cc cd ab ad cb da dc bc ba dd db bd bb a b aaa aab aba aac aad abc c d aca acb acc Can we make Intelligent Icons for time series? Yes, with SAX! accbabcdbcabdbcadbacbdbdcadbaacb… c c c b b b a a Time Series Bitmap
While they are all example of EEGs, example_a.dat is from a normal trace, whereas the others contain examples of spike-wave discharges.
300 One Year of Italian Power Demand 200 100 December January August 0 We can further enhance the time series bitmaps by arranging the thumbnails by “cluster”, instead of arranging by date, size, name etc We can achieve this with MDS. We can further enhance the time series bitmaps by arranging the thumbnails by “cluster”, instead of arranging by date, size, name etc We can achieve this with MDS. August.txt July.txt June.txt April.txt May.txt Sept.txt Oct.txt Feb.txt Dec.txt March.txt Nov.txt Jan.txt
Text Example Here are some papers that reference Eamonn Keoghs work…
Paper on using Paper on using “warping” to “warping” to classify classify Cluster of Cluster of classification papers “classification” papers Cluster of “warping” papers Cluster of “warping” papers Classification Classification paper in Italian paper in Italian “Warping” paper “Warping” paper in Portuguese in Portuguese Text Example
Paper Summary • We show how to map DNA, time series and natural language into intelligent icons. • We give a generic framework for mapping any kind of data into intelligent icons. • We show the utility of intelligent icons for finding patterns (clusters, outliers etc)