Download
1 / 16
160 likes | 265 Views
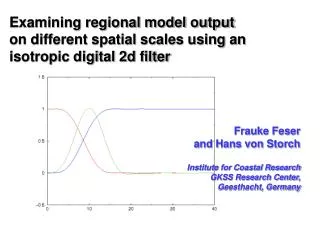
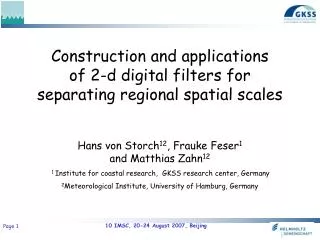
Construction and applications of 2-d digital filters for separating regional spatial scales Hans von Storch 12 , Frauke Feser 1 and Matthias Zahn 12 1 Institute for coastal research, GKSS research center, Germany 2 Meteorological Institute, University of Hamburg, Germany. Talk structure:

E N D
Construction and applications of 2-d digital filters for separating regional spatial scales Hans von Storch12, Frauke Feser1and Matthias Zahn12 1 Institute for coastal research, GKSS research center, Germany 2Meteorological Institute, University of Hamburg, Germany
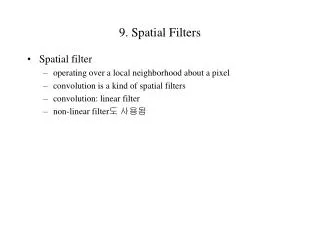
Talk structure: • Construction of a 2D-filter • Filter applications: • added value in RCM simulations • characterization of typhoon patterns • detection of polar lows
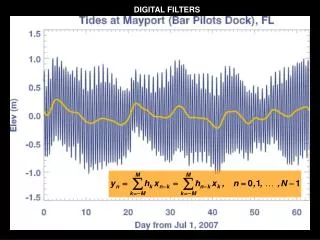
Response function of a filter With certain constants k. represents the grid distance. Note that the filtering calculates a weighted average of the „base point“ f(x) and its K neighbours to the right and to the left. At the interval ends this causes problems. However, in case of regional modelling the interval ends are irrelevant because of the „sponge zones“. When the digital filter is applied to a spectrally represented function The filtered function f* may be written as with the „response function“
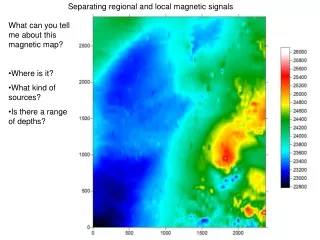
For analytical purposes, we are in need for 2-d isotropic filters, which separate large, medium and small spatial scales in a limited (regional) gridded field. Feser, F., and H. von Storch, 2005: Spatial two-dimensional discrete filters for limited area model evaluation purposes. Mon. Wea Rev. 133, 1774-1786
The construction of a 2d digital filter Filter should have ideally identical response functions for all waves of same 2-d wavelength. The filter array (footprint) must be quadratic and symmetrical in respect to the meridional and to the zonal, but also to both diagonals. Thus only a few filter weights need to be determined, the remaining ones are given by symmetry.
The construction of a 2d digital filter • We construct an 2d-filter, which approximate a given response function with • (k) 0 for 0≤ k ≤ k1 and k2 ≤ k ≤ kmax, and • - (k) 1 for k1≤k≤k2: • This filter suppresses most of the variance on certain frequency bands, while retaining almost all variance on others. • The sum of large-scale, band-pass and small-scale contributions do not add up to the original field.
Determining the weights k When more „responses“ k are specified than filter weights, then an underspecified set of linear equations with the weights k, k=0...K combine the unknown weights and these responses: Minimizing the error at the “too many” wave-numbers with a specified response leads to a matrix problem, which can be solved with conventional algebraic methods. It remains the choice of the “too many” specified responses k. We treat this as a matter of trial- and error.
Filter Weights / Footprint Low-pass Band-pass High-pass Grid points Grid points Grid points Grid points Grid points Grid points Filters were chosen with N = 8 points, so that their spatial extension is (2N + 1)x(2N + 1) = 17x17 points.
Response Functions Low-pass Band-pass High-pass Wave number l Wave number l Wave number l Wave number k Wave number k Wave number k Response functions associated with the filter weights of the last figure.
Analysis of RCM output Determination of added value in an RCM driven reconstruction of regional weather Characterization of simulation typhoon patterns Detection of polar Lows in RCM simulations Application of filters
PCC improvement/ deterioration RCM Nudge PCC DWD and NCEP PCC improvement/ deterioration RCM Standard Pattern correlations (%) Positive values show added value of the regional model. 95% significant deviations are marked by a *.
Typhoon Winnie (1997): filtered SLP fields Spatially filtered air pressure field Left sides: NCEP re-analysis after interpolation on 50 km grid; Right sides: RCM simulation on 50 km grid. large scales retained, (diameter ≥600 km) medium scales retained (≤360 km; ≥180 km) small scales retained (≤ 180 km)
Weather chart, 18.1.1998, 1:00 Example: detection of polar low Woetmann Nielsen, N., Om forudsigelighed af polare lavtryk, Vejret, 20, 37–48, in Danish, 1998 band-pass filtered Full field
Summary • We have constructed a family of 2-d near-isotropic digital filters suitable for analysing the output of RCMs (on a limited grid). • The filters approximate a given response function. • The filters are not additive. • We use the filters, in particular the band-pass filters, routinely for • Determining added value of RCM simulations over the driving large-scale analysis • Characterizing meso-scale structures of “small” cyclones • Automatic detection of meso-scale features, such as polar lows.