Download
1 / 56
560 likes | 563 Views
This case study explores the value of detailed fertility data in Switzerland, examining trends in age at childbearing, fertility rates by parity, and cohort fertility rates. The talk also discusses the strengths and weaknesses of Swiss fertility data and provides predictions for future fertility rates.

E N D
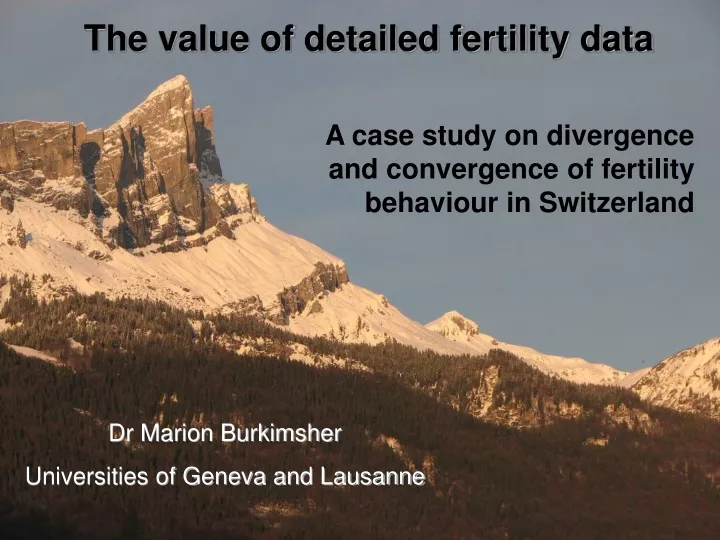
The value of detailed fertility data A case study on divergence and convergence of fertility behaviour in Switzerland Dr Marion Burkimsher Universities of Geneva and Lausanne
Glaciology Demography Snow Births Immigr-ation Emigr-ation Glacier Population Meltwater Deaths Sublimin-ation
Questions to explore • How are Switzerland's fertility data resources superior to those in many other countries? • But what are the weaknesses, and how can they be overcome? • Is age at childbearing still rising in Switzerland? • Why has there been a recent rise in the total fertility rate? • Is there more variability in the age at which women have their children now than in the past? • Is there more variability in how many children they have than in the past?
Structure of talk • Introduction to Swiss demographic features • Data overview and estimation of biological parity • Trends in age at birth of each parity • Period trends in fertility rates by parity • Cohort fertility rates • Predictions of fertility rates • Overview of answers to questions posed and conclusions
Structure of talk • Introduction to Swiss demographic features • Data overview and estimation of biological parity • Trends in age at birth of each parity • Period trends in fertility rates by parity • Cohort fertility rates • Predictions of fertility rates • Overview of answers to questions posed and conclusions
Swiss demographic landscape • Possibly world’s highest mean age at first birth (almost 30) • High proportion of women who remain childless • TFR reached a minimum of 1.38 in 2001, rising since then • Relatively low proportion of births outside marriage • High proportion of foreign nationals
Peak of 2nd wave of Baby Boom, 2.67 in 1963-4 1.51 in 1978 1.50 in 2009 1.59 in 1990 Min 1.38 in 2001
Structure of talk • Introduction to Swiss demographic features • Data overview and estimation of biological parity • Trends in age at birth of each parity • Period trends in fertility rates by parity • Cohort fertility rates • Predictions of fertility rates • Overview of answers to questions posed and conclusions
Data sources BEVNAT - registration of births by age of mother ESPOP - population of Swiss women by age at mid-year Census 2000 - answers to the question “Are you the father or mother of one or several children? If so, how many and what years were they born in?” Surveys including fertility question(s): Fertility and Family Survey (FFS) Swiss Household Panel (SHP) World Values Survey/European Values Study (WVS/EVS) European Social Survey (ESS) Generations and Gender Survey (2013)
Birth Registration data • 1969-1997 Computerised database, but parity only registered “au sein du lit actuel”, ie. birth order within the current marriage. Births outside marriage were all registered as parity 0. • 1998-2004 Biological parity started to be registered in addition to parity within current marriage, but quite a lot of unknowns. • 2005-2009.. Accurate recording of both biological parity and parity within current marriage. Important as large growth in number of births outside marriage and births in second/subsequent marriages. • Re-processing of pre-2005 data to obtain estimates of true biological parity
Sample of 2009 data table
Process of modelling biological parity from 1998-2008 data to apply to pre-1998 data Assume that proportion of births outside marriage attributable to each biological parity is age-dependent, ie 100% of births to girls <=15 are 1st births and this % declines with increasing age of mother Similarly, where parity in marriage is not equal to biological parity this will be age-dependent. Women have had more possibility for multiple marriages / births outside marriage as they get older! With 1998-2004 data used only data where biological parity was known
Assumptions for data 1998-2004 If biological parity was recorded it was considered correct The distribution of parities which were recorded as unknown follows the same distribution pattern as in the pre-1998 data model (an extrapolation from the 1998-2008 data)
Model • Calculated the mean % for each age and each parity from the 1998-2008 data, then for pre-1998 data re-assigned each parity using these percentages. • Even though there may have been a trend over time, it would be dangerous to extrapolate that trend backwards in time - would it continue linearly, for how long, etc…?? • This may mean that for • births outside marriage at older ages - too many assigned to parities greater than 1 (but not so many of them in past) • births within marriage - too many re-assigned to a higher parity than there actually were
New database created for Swiss fertility data • by age • and by correct biological parity! • Can compare with cohort fertility as recorded in Census 2000 • But census data is not perfect…
Structure of talk • Introduction to Swiss demographic features • Data overview and estimation of biological parity • Trends in age at birth of each parity • Period trends in fertility rates by parity • Cohort fertility rates • Predictions of fertility rates • Overview of answers to questions posed and conclusions
Changes in fertility rate curves in period 1969-2009 Peak has become later Peak has become lower Curve has become wider Curve has changed from being skewed left to nearly symmetric
Decline in birth rates under 30, increase in birth rates over age 30
In 1970 there was 11 years between modal age of 1st and 4th births In 2007 the difference was only 2 years!
Median has increased steadily from 23 to 29 over 40 year period (6 years)First decile has gone up from 19 to 22 (3 years)9th decile has gone up from 30 to 36 (6 years)
Gap between mean age at 1st birth and 4th birth declined from 8 years in 1972 to 4.9 in 1990 and since then has been steady Parity 1 increase started 1971Parity 2 increase started 1973Parity 3 increase started 1980Parity 4 increase started 1986Parity 5+ increase started 1991
But doesn’t necessarily mean that birth spacing is getting closer!!
Parity 1 increase started 1994Parity 2 increase started 1995Parity 3 increase started 1998Parity 4 increase started 2001Parity 5+ increase started 2001 Reversal in order! Parity 1 had least variability,now most; high parities were most variable, now least
Structure of talk • Introduction to Swiss demographic features • Data overview and estimation of biological parity • Trends in age at birth of each parity • Period trends in fertility rates by parity • Cohort fertility rates • Predictions of fertility rates • Overview of answers to questions posed and conclusions
In the 2000 Swiss census, each person was asked how many children they had had. For women born in 1960 - who were, therefore, aged 40, and so approaching the end of their childbearing years - the mean number of children they had had was 1.73 The Population Reference Bureau’s definition of TFR is “The average number of children that would be born alive to a woman during her lifetime if she were to pass through her childbearing years conforming to the age-specific fertility rates of a given year” But the mean TFR for the period 1980-1999 was 1.53! Why the big difference between 1.53 and 1.73?
Possible reasons for mismatch between • period fertility rates and cohort fertility rates • Data errors: • Birth registrations • Population totals by age • “Sampling” errors in the census • Change in population between years of birth and census • Differential mortality • Immigration and emigration • Postponement of childbearing
Bongaarts-Feeney correction Tempo-adjusted TFR is the value expected if there had been no change in age at childbearing: Raw FR (1-rp) where rpdenotes the rate of change in the period mean age at childbearing in year t. Needs to be applied to each parity separately because each parity may be affected by postponement at different times and to differing degrees! Used 5 year moving average of delays for each parity, except for 2008 (3 yr moving average) and 2009 (extrapolation)
0.87 0.89 0.86 0.77 0.76 Peaks for parity 1 in 1984-5 and 2006 Troughs in 1978-9 and 1997 Peak for parity 2 in 1986-7Marked rise in parity 2 since 2006 Peak for parity 3 in 1990
Marked rise 1976-1984, followed by gentle fallSlight peak in 2000 followed by sharp dip in 2001Since 2001 has been steadily rising Rise in TFR between 2007 and 2009 was due to increase in parity 2 fertility rates Rise in TFR between 2001 and 2006 was due to rise in parity 1 fertility rates, ie. decline in incidence of childlessness
Structure of talk • Introduction to Swiss demographic features • Data overview and estimation of biological parity • Trends in age at birth of each parity • Period trends in fertility rates by parity • Cohort fertility rates • Predictions of fertility rates • Overview of answers to questions posed and conclusions
Cohort fertility Used parity-by-parity birth rates calculated from period data to estimate cohort fertility With re-assignment of parities using model For comparison with census data use birth data up to (and including) year 2000
Cohort sizes have changed considerably (>30% for cohorts 1965 and 1970 during the course of their reproductive life)! There has been large net immigrationComparison suggests fertility rate of residentsand newcomers is identical
Model for estimating cohort fertility before full reproductive life is complete Can use it as soon as cohort has passed age of peak fertility for parity 1 (ideally also parity 2) Use cohort data to complete the curve with current year’s period data. This will ‘probably’ give an under-estimate of total fertility of youngest cohorts, as ongoing postponement will cause ongoing depression of fertility rates (for a while). Can be improved by making Bongaarts-Feeney correction to this added period data. However, this might give an over-estimate of the total cohort fertility, as there is ‘likely’ to be a slowing down on postponement in the future.
Birth registration data, biological parity model Dashed lines - extrapolated with period data Continuous lines - extrapolated with period data with B-F correction assuming ongoing postponement Census data plus births after 2000
Mismatches Could be errors in the biological parity model - need to check Could be due to population movements Could be due to different measures of the resident population inthe census and that used to calculate fertility rates Or…?
Structure of talk • Introduction to Swiss demographic features • Data overview and estimation of biological parity • Trends in age at birth of each parity • Period trends in fertility rates by parity • Cohort fertility rates • Predictions of fertility rates • Overview of answers to questions posed and conclusions