Download
1 / 19
190 likes | 344 Views
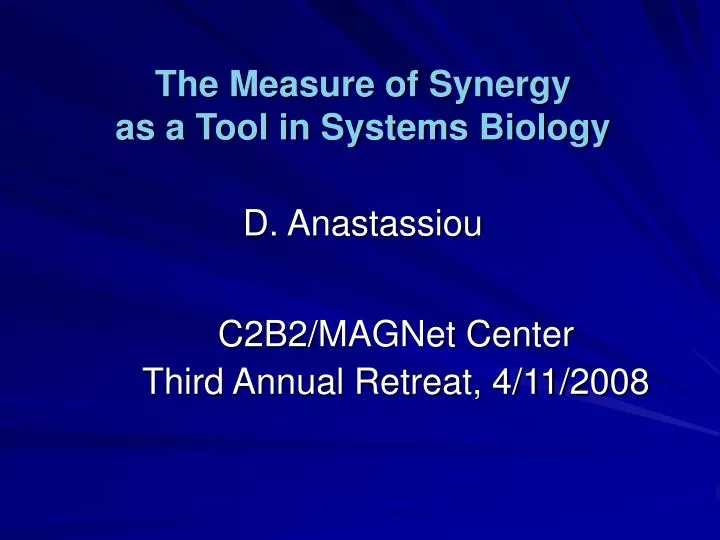
The Measure of Synergy as a Tool in Systems Biology D. Anastassiou. C2B2/MAGNet Center Third Annual Retreat, 4/11/2008. Synergy.

E N D
The Measure of Synergy as a Tool in Systems BiologyD. Anastassiou C2B2/MAGNet Center Third Annual Retreat, 4/11/2008
Synergy • Definition: “The interaction of two or more agents or forces so that their combined effect is greater than the sum of their individual effects” (American Heritage Dictionary) • Natural application in systems biology (holistic as opposed to reductionist paradigm): We wish to analyze multiple interacting factors in terms of the purely cooperative nature of their contributions towards an outcome. D. Anastassiou, "Computational Analysis of the Synergy Among Multiple Interacting Genes" (Review Article), Molecular Systems Biology, Vol. 3, No. 83, February 2007.
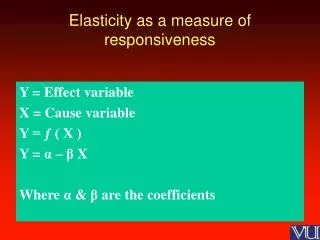
Information-theoretic definition Synergy of two factors Gi, Gj with respect to an outcome C: Synergy can be positive or negative (redundancy) and extended to more than two factors.
Example: Synergy of two genes with respect to a phenotype Given a large set of gene expression data in both presence and absence of a phenotype such as cancer, we can estimate the information I(Gi; C) that any gene Gi provides about cancer C, CONDITIONS GENES as well as the information I(Gi,Gj; C) that any pair of two genes (Gi, Gj), jointly provide about cancer C. HEALTH CANCER
Best gene pairs for classification Extension of “gene ranking” based on I(Gi; C) to “gene-pair ranking” based on I(Gi,Gj; C) Observation: Sometimes high-ranked gene pairs do not include any of the high-ranked single genes, suggesting that the correlation of the gene pair with cancer is due to a purely cooperative effect of the two genes. V. Varadan and D. Anastassiou, “Inference of Disease-Related Molecular Logic from Systems-Based Microarray Analysis,” PLoS Computational Biology, Vol. 2, Issue 6, June 2006, pp. 585-597. This purely cooperative effect can be quantified!
What is the “cancer interactome”? High correlation: I(Gi,Gj; C) >> 0 implies that the two genes can be jointly used for classification • High synergy: I(Gi,Gj; C) >> I(Gi; C) + I(Gj; C) ≥ 0 • further implies that the two genes Gi and Gj “interact” with respect to cancer, and can be used to construct a • “synergynetwork,” a graph with nodes represent genes and edges connect significantly high-synergy gene pairs. • J. Watkinson, X. Wang, T. Zheng, D. Anastassiou, “Identification of gene interactions associated with disease from gene expression data using synergy networks,” BMC Systems Biology, February 2008
Example of scatter plot for highest-synergy gene pair from prostate cancer data 50 green (healthy) and 52 red (cancerous) dots Cancer = (Low RBP1) AND (High EEF1B2)
Using synergy for inference of gene regulatory interactions The “phenotype” can be the expression level of a third gene
Application to “Challenge 5”of the DREAM2 conference Given: A “blinded” compendium of 300 normalized Affymetrix microarray experiments from E. coli, involving 3,456 genes out of which 120 (also blinded) transcription factors. Challenge: Reconstruct a genome-scale transcriptional network (identify TF-target interactions). Score based on known “ground truth” from chromatin precipitation and otherwise experimentally verified Transcription Factor (TF)-target interactions (from RegulonDB).
“Three-way” mutual information (common to three genes) Can be estimated from continuous data
Three-way mutual information is the opposite of synergy! I(G1;G2;G3) can be negative, in which case there is no Venn diagram possible. • It turns out that -I(G1;G2;G3) is equal to • I(G1,G2; G3) - [I(G1;G3)+I(G2;G3)] = • I(G2,G3; G1) - [I(G2;G1)+I(G3;G1)] = • I(G1,G3; G2) - [I(G1;G2)+I(G3;G2)] • the synergy of two of the genes with respect to the third.
Synergistic “entanglement” of three genes If I(G1;G2;G3) << 0, this suggests that there is some interaction mechanism connecting the three genes, and the positive quantity -I(G1;G2;G3) can be seen as measuring their synergistic “entanglement.” In that case, one likely scenario is that one of the three genes is, at least partly or indirectly, synergistically regulated by the other two.
Most-likely regulated gene in a synergistically entangled triplet • I(Gi,Gk; Gj) ≥ max {I(Gi,Gj; Gk), I(Gk,Gj; Gi} • Or, as it turns out, equivalently: • I(Gi;Gk) ≤ min {I(Gi;Gj) , I(Gk;Gj)}
Synergistic regulation index Measures the degree of confidence that gene Gi cooperatively regulates gene Gj It also identifies Gk as the best synergistic partner of Gi for the regulation of Gj Can be used to augment the traditional MI measure: M(i, j) = I(Gi;Gj)
Final score for Gi→ Gj regulation computed from 2-way and 3-way MI values. Turns out that it is equal to:
Results GISL: Among top 150 predictions, 106 were in “ground truth.”
Potential for biological discovery using synergy:Large number of statistically significant entangled triplets
Conclusions and acknowledgements Synergy-based methodologies have the potential to contribute towards empowering systems biology to achieve genuine biological discovery by identifying multiple interacting contributing factors, such as genes, SNPs and CNVs. Co-authors: Prof. Tian Zheng, Statistics, Columbia University Prof. Xiaodong Wang, EE, Columbia University Ph.D. students: John Watkinson, Kuo-ching Liang