Download
1 / 30
300 likes | 454 Views
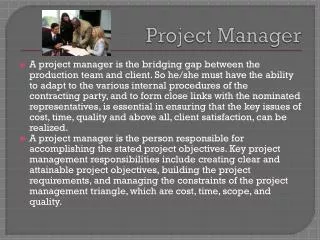
2012 Desiree Nangle, Evaluation Project Manager Desiree.nangle@anglicarewa.org.au. SIMPLE COMMON SENSE PLAIN LANGUAGE MINIMUM PAPER USEFUL. With thanks to. The Fiscal Policy Studies Institute Santa Fe, New Mexico. What is Results Based Accountability?.

E N D
2012 Desiree Nangle, Evaluation Project Manager Desiree.nangle@anglicarewa.org.au
SIMPLE COMMON SENSE PLAIN LANGUAGE MINIMUM PAPER USEFUL
With thanks to The Fiscal Policy Studies Institute Santa Fe, New Mexico
What is Results Based Accountability? • Starts with ends and works backwards to means • Ends are how customers are better off when the program works the way it should • RBA is meant to get you from talk to action quickly • Used for continuous program improvement • Inclusive process
August, 2012 Results Based Accountabilityis made up of two parts: POPULATION ACCOUNTABILITY Is about the well-being of WHOLE POPULATIONS For Communities – Cities – Counties – States - Nations PERFORMANCE ACCOUNTABILITY Is about the well-being of CUSTOMER POPULATIONS For Programs – Agencies – Services
7 Performance Accountability Questions • Who are our customers? • How can we measure if our customers are better off? • How can we measure if we are delivering services well? • How are we doing on the most important of these measures? • Who are the partners that have a role to play in boing better? • What works to do better, including low-cost and no-cost ideas? • What do we propose to do?
7 Performance Accountability Questions • Who are our customers? • How can we measure if our customers are better off? • How can we measure if we are delivering services well? • How are we doing on the most important of these measures? • Who are the partners that have a role to play in boing better? • What works to do better, including low-cost and no-cost ideas? • What do we propose to do?
Performance Measures Quality Quantity How welldid we deliver it? How much service did we deliver? Effect Effort How much change / effect did we produce? What quality of change / effect did we produce?
Types of Measures Found in Each Quadrant Quality Quantity How well did we do it? How much did we do? • Client Satisfaction • Standards • Unit Costs • Wait List • Staff Quality • Targets • Number Clients • Number Activities Effect Effort Is anyone better off? • Skills and Knowledge • Attitude and Opinion • Behaviour • Circumstance
Mums and Dads Forever 2012 Quality Quantity How well did we do it? How much did we do? • No shows/Drop out rates • Bookings for intake • Intake group • Group to completion • Level of satisfaction Family Court has with MDF • Staff satisfaction • Reconnects • Number of groups • Number of clients Effect Effort Is anyone better off? • % of parents with more of a child focus • assessed using client self-reported perceptions in questionnaire • % of parents with less parent to parent conflict • % of parents with decreased litigation • Assessed via Family Court feedback questionnaire • % of clients seeking other services • % of parents with improved ability to co-parent • % of parents with improved self-awareness
Not All Performance Measures Are Created Equal Quality Quantity How well did we do it? How much did we do? LeastImportant Least AlsoVery Important Effect Effort Is anyone better off? MostImportant Most
The Matter of Control Quality Quantity How well did we do it? How much did we do? MostControl Effect Effort Is anyone better off? LeastControl
ONE PAGE Turn the Curve Report: Performance Program: _______________ PerformanceMeasureBaseline Story behind the baseline --------------------------- --------------------------- Partners --------------------------- --------------------------- Three Best Ideas – What Works1. --------------------------- 2. --------------------------- 3. ---------No-cost / low-cost 4. --------- Off the Wall
75% 19 in Phase 3 7 81% 66% (48 out of 61 services) =78% 33% (1 service) = 2% RBAon RBA Updated: March 2013 Quality Quantity How well did we do it? How much did we do? • staff satisfaction with training and support • # RBA facilitators trained • time to self-sustainability • time programs spend in each stage • validity of measures • validity of data • # of active services by phases • # of staff involved in active services by phase Effect Effort Is anyone better off? • % staff that understand what RBA is • % staff that support RBA within Anglicare WA • % services implementing RBA • % services using RBA for program improvement • % services with the capacity to use RBA unassisted • % of curves turned
Do staff understand what RBA is? December 2011: 53.6% Agree April 2012: 68.3% Agree August 2012: 73.5% Agree March 2013: 80.9% Agree 2013
Do staff think RBA is good for Anglicare? December 2011: 55.2% Agree April 2012: 60.4% Agree August 2012: 66.3% Agree March 2013: 66.1% Agree 2013
Challenges of RBA Opportunities with RBA Open-ended response 2012
ONE PAGE Turn the Curve Report: Performance Program: _______________ Performance Measure PerformanceMeasureBaseline Story behind the baseline --------------------------- --------------------------- (List as many as needed) Partners --------------------------- --------------------------- (List as many as needed) Three Best Ideas – What Works 1. --------------------------- 2. --------------------------- 3. ---------No-cost / low-cost 4. --------- Off the Wall Four Phases of Implementation
Check out these cool metrics! What if my program doesn’t show success? What does the data say? I know I should be measuring but I don’t know how What we do is an not a science. It can’t be measured
The Task (1) Quadrant exercise: Performance measures • How much did we do? • How well did we do it? • Is anyone better off?
Types of Measures Found in Each Quadrant Quality Quantity How well did we do it? How much did we do? • Client Satisfaction • Standards • Unit Costs • Wait List • Staff Quality • Targets • Number Clients • Number Activities Effect Effort Is anyone better off? • Skills and Knowledge • Attitude and Opinion • Behaviour • Circumstance