Download
1 / 1
10 likes | 112 Views
Measurement of b-tagging Fake rates in Atlas Data M. Saleem * In collaboration with Alexandre Khanov** F. Raztidinova**, P.Skubic * * University of Oklahoma, USA; **Oklahoma State University, USA saleem@mail.cern.ch. USAtlas meeting, NewYork University

E N D
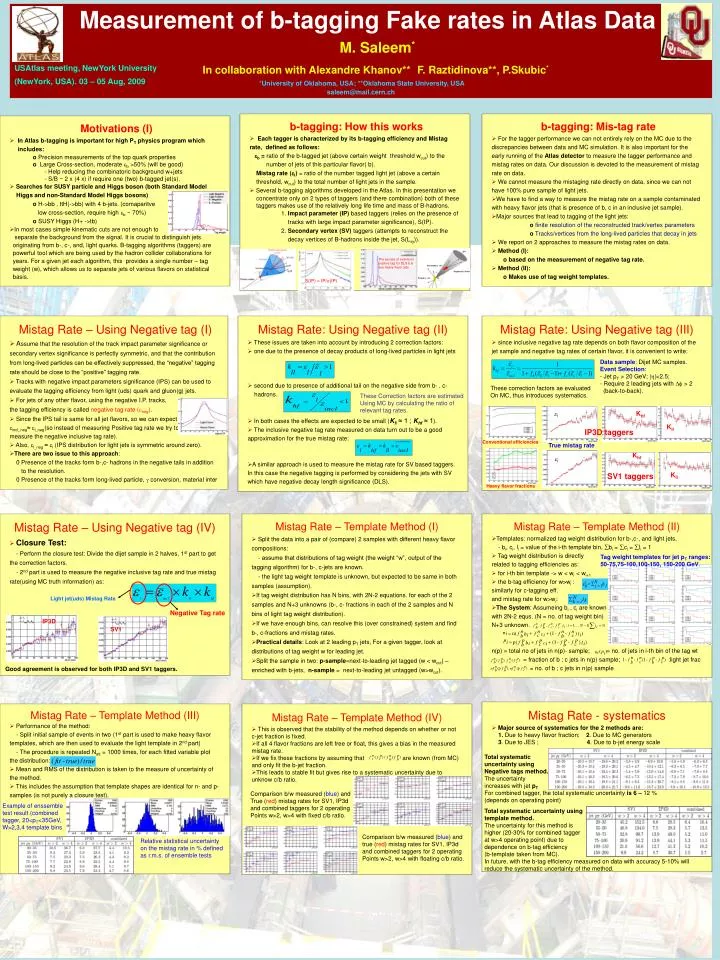
Measurement of b-tagging Fake rates in Atlas Data M. Saleem* In collaboration with Alexandre Khanov**F. Raztidinova**, P.Skubic* *University of Oklahoma, USA; **Oklahoma State University, USA saleem@mail.cern.ch USAtlas meeting, NewYork University (NewYork, USA). 03 – 05 Aug, 2009 b-tagging: How this works • Each tagger is characterized by its b-tagging efficiency and Mistag rate, defined as follows: b = ratio of the b-tagged jet (above certain weight threshold wcut) to the number of jets of this particular flavor( b). Mistag rate (l) = ratio of the number tagged light jet (above a certain threshold, wcut) to the total number of light jets in the sample. • Several b-tagging algorithms developed in the Atlas. In this presentation we • concentrate only on 2 types of taggers (and there combination) both of these • taggers makes use of the relatively long life time and mass of B-hadrons. 1. Impact parameter (IP) based taggers (relies on the presence of tracks with large impact parameter significance), S(IP). 2. Secondary vertex (SV) taggers (attempts to reconstruct the decay vertices of B-hadrons inside the jet, S(Lxy)). b-tagging: Mis-tag rate • For the tagger performance we can not entirely rely on the MC due to the discrepancies between data and MC simulation. It is also important for the early running of the Atlas detector to measure the tagger performance and mistag rates on data.Our discussion is devoted to the measurement of mistag rate on data. • We cannot measure the mistaging rate directly on data, since we can not have 100% pure sample of light jets. • We have to find a way to measure the mistag rate on a sample contaminated with heavy flavor jets (that is presence of b, c in an inclusive jet sample). • Major sources that lead to tagging of the light jets: o finite resolution of the reconstructed track/vertex parameters o Tracks/vertices from the long-lived particles that decay in jets • We report on 2 approaches to measure the mistag rates on data. • Method (I): o based on the measurement of negative tag rate. • Method (II): o Makes use of tag weight templates. Motivations (I) • In Atlas b-tagging is important for high PT physics program which includes: o Precision measurements of the top quark properties o Large Cross-section, moderate b >50% (will be good) - Help reducing the combinatoric background w+jets - S/B ~ 2 x (4 x) if require one (two) b-tagged jet(s). • Searches for SUSY particle and Higgs boson (both Standard Model Higgs and non-Standard Model Higgs bosons) o H->bb , ttH(->bb) with 4 b-jets. (comaparitve low cross-section, require high b ~ 70%) o SUSY Higgs (H+ ->tb) • In most cases simple kinematic cuts are not enough to separate the background from the signal. It is crucial to distinguish jets originating from b-, c-, and, light quarks. B-tagging algorithms (taggers) are powerful tool which are being used by the hadron collider collaborations for years. For a given jet each algorithm, this provides a single number – tag weight (w), which allows us to separate jets of various flavors on statistical basis. The excess of events on positive tag for DLS b is due heavy flavor jets S(IP) = IP/(IP) Mistag Rate – Using Negative tag (I) • Assume that the resolution of the track impact parameter significance or secondary vertex significance is perfectly symmetric, and that the contribution from long-lived particles can be effectively suppressed, the “negative” tagging rate should be close to the “positive” tagging rate. • Tracks with negative impact parameters significance (IPS) can be used to evaluate the tagging efficiency from light (uds) quark and gluon(g) jets. • For jets of any other flavor, using the negative I.P. tracks, the tagging efficiency is called negative tag rate (neg). • Since the IPS tail is same for all jet flavors, so we can expect incl_neg≈ l_neg(so instead of measuring Positive tag rate we try to measure the negative inclusive tag rate). • Also, l_neg ≈ l (IPS distribution for light jets is symmetric around zero). • There are two issue to this approach: 0 Presence of the tracks form b-,c- hadrons in the negative tails in addition to the resolution. 0 Presence of the tracks form long-lived particle, conversion, material inter Mistag Rate: Using Negative tag (II) • These issues are taken into account by introducing 2 correction factors: • one due to the presence of decay products of long-lived particles in light jets • second due to presence of additional tail on the negative side from b- , c- hadrons. • In both cases the effects are expected to be small (Kll ≈ 1 ; Khf ≈ 1). • The inclusive negative tag rate measured on data turn out to be a good approximation for the true mistag rate: • A similar approach is used to measure the mistag rate for SV based taggers. In this case the negative tagging is performed by considering the jets with SV which have negative decay length significance (DLS). Mistag Rate: Using Negative tag (III) • since inclusive negative tag rate depends on both flavor composition of the jet sample and negative tag rates of certain flavor, it is convenient to write: • Data sample: Dijet MC samples. • Event Selection: • Jet pT > 20 GeV; ||<2.5; • Require 2 leading jets with > 2 • (back-to-back). These correction factors ae evaluated On MC, thus introduces systematics. These Correction factors are estimated Using MC by calculating the ratio of relevant tag rates. Khf l Kll IP3D taggers Conventional efficiencies True mistag rate Khf l Kll SV1 taggers Heavy flavor fractions Mistag Rate – Using Negative tag (IV) • Closure Test: - Perform the closure test: Divide the dijet sample in 2 halves, 1st part to get the correction factors. - 2nd part is used to measure the negative inclusive tag rate and true mistag rate(using MC truth information) as: Mistag Rate – Template Method (I) • Split the data into a pair of (compare) 2 samples with different heavy flavor compositions: - assume that distributions of tag weight (the weight “w”, output of the tagging algorithm) for b-, c-jets are known. - the light tag weight template is unknown, but expected to be same in both samples (assumption). • If tag weight distribution has N bins, with 2N-2 equations. for each of the 2 samples and N+3 unknowns (b-, c- fractions in each of the 2 samples and N bins of light tag weight distribution). • If we have enough bins, can resolve this (over constrained) system and find b-, c-fractions and mistag rates. • Practical details: Look at 2 leading pT jets, For a given tagger, look at distributions of tag weight w for leading jet. • Split the sample in two: p-sample=next-to-leading jet tagged (w < wcut) – enriched with b-jets, n-sample = next-to-leading jet untagged (w>wcut). Mistag Rate – Template Method (II) • Templates: normalized tag weight distribution for b-,c-, and light jets. - bi, ci, li = value of the i-th template bin, bi = ci = li = 1 • Tag weight distribution is directly related to tagging efficiencies as: • for i-th bin template -> w < wi < wi+1 • the b-tag efficiency for w>wi : similarly for c-tagging eff. and mistag rate for w>wi: • The System: Assumeing bi , ci are known with 2N-2 equs. (N = no. of tag weight bin) N+3 unknown. n(p) = total no of jets in n(p)- sample; = no. of jets in i-th bin of the tag wt = fraction of b ; c jets in n(p) sample; :light jet frac = no. of b ; c jets in n(p) sample Tag weight templates for jet pT ranges: 50-75,75-100,100-150, 150-200 GeV. Light jet(uds) Mistag Rate Negative Tag rate IP3D SV1 Good agreement is observed for both IP3D and SV1 taggers. Mistag Rate - systematics • Major source of systematics for the 2 methods are: 1. Due to heavy flavor fraction; 2. Due to MC generators 3. Due to JES ; 4. Due to b-jet energy scale Mistag Rate – Template Method (III) • Performance of the method: - Split initial sample of events in two (1st part is used to make heavy flavor templates, which are then used to evaluate the light template in 2nd part) - The procedure is repeated Natt = 1000 times, for each fitted variable plot the distribution: • Mean and RMS of the distribution is taken to the measure of uncertainty of the method. • This includes the assumption that template shapes are identical for n- and p- samples (is not purely a closure test). Mistag Rate – Template Method (IV) • This is observed that the stability of the method depends on whether or not c-jet fraction is fixed. • If all 4 flavor fractions are left free or float, this gives a bias in the measured mistag rate. • If we fix these fractions by assuming that are known (from MC) and only fit the b-jet fraction. • This leads to stable fit but gives rise to a systematic uncertainty due to unknow c/b ratio. Total systematic uncertainty using Negative tags method. The uncertainty increases with jet pT For combined tagger, the total systematic uncertainty is 6 – 12 % (depends on operating point) Comparison b/w measured (blue) and True (red) mistag rates for SV1, IP3d and combined taggers for 2 operating Points w>2, w>4 with fixed c/b ratio. Example of enssemble test result (combined tagger, 20<pT<35GeV, W>2,3,4 template bins Total systematic uncertainty using template method. The uncertainty for this method is higher (20-30% for combined tagger at w>4 operating point) due to dependence on b-tag efficiency (b-template taken from MC). In future, with the b-tag efficiency measured on data with accuracy 5-10% will reduce the systematic uncertainty of the method. Comparison b/w measured (blue) and true (red) mistag rates for SV1, IP3d and combined taggers for 2 operating Points w>2, w>4 with floating c/b ratio. Relative statistical uncertainty on the mistag rate in % defined as r.m.s. of ensemble tests