Download
1 / 13
130 likes | 288 Views
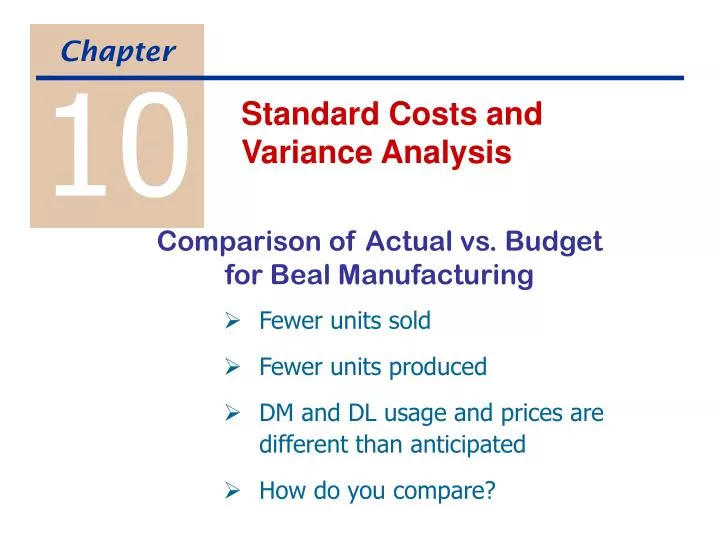
10. Chapter. Standard Costs and Variance Analysis. Comparison of Actual vs. Budget for Beal Manufacturing. Fewer units sold Fewer units produced DM and DL usage and prices are different than anticipated How do you compare?. 7500 units. 7900 units. Sales. $1,800,000. $1,975,000.

E N D
10 Chapter Standard Costs and Variance Analysis Comparison of Actual vs. Budget for Beal Manufacturing • Fewer units sold • Fewer units produced • DM and DL usage and prices are different than anticipated • How do you compare?
7500 units 7900 units Sales $1,800,000 $1,975,000 CGS 1,252,213 1,264,000 Gross Marg $ 547,787 $ 711,000 Sell & Admin Var 108,000 110,600 Fixed 271,000 280,000 Oper Inc $ 320,400 $ 168,787 Actual Static Budget Comparing actual results to the static budget is not very useful. • Some of the difference is due to sales volume. • Some is due to inefficiency. • A flexible budget is helpful.
$ 547,787 $ 711,000 $ 320,400 $ 168,787 Actual Flexible Budget Static Budget 7500 units 7900 units Sales $1,800,000 $1,975,000 CGS 1,252,213 1,264,000 Gross Marg Sell & Admin Var 108,000 110,600 Fixed 271,000 280,000 Oper Inc Flexible budget based on budgeted rates and actual units sold
$ 711,000 $ 547,787 $ 675,000 $290,000 $ 320,400 $ 168,787 Actual Flexible Budget Variance Flexible Budget Sales Volume Variance Static Budget 7500 units 7500 units 7900 units Sales $1,800,000 $1,875,000 $1,975,000 CGS 1,252,213 1,200,000 1,264,000 Gross Marg Sell & Admin Var 108,000 105,000 110,600 Fixed 271,000 280,000 280,000 Oper Inc Deserves a closer look. Net impact of low sales volume.
$1,256,000 $1,305,580 Actual Flexible Budget List the detail for actual production costs. 7800 units 7800 units DM - input 23,100 lbs - price $5.20 DL - input 40,100 hrs - price $14.60 VOH - rate ? $5.90 DM $120,120 $ 117,000 DL 585,460 585,000 Manuf OH List corresponding detail for a flexible budget. Variable 236,590 234,000 Fixed 363,410 320,000 CG Manuf
7800 units 7800 units DM - input 23,100 lbs 23,400 lbs - price $5.20 $5.00 DL - input 40,100 hrs 39,000 hrs - price $14.60 $15.00 VOH - rate $5.90 $6.00 DM $120,120 $ 117,000 DL 585,460 585,000 $1,256,000 $1,305,580 Manuf OH Variable 236,590 234,000 Fixed 363,410 320,000 CG Manuf Actual Price Variance Act Input x Budg Price Usage Variance Flexible Budget
7800 units 7800 units DM - input 23,100 lbs 23,400 lbs - price $5.20 $5.00 DL - input 40,100 hrs 39,000 hrs - price $14.60 $15.00 VOH - rate $5.90 $6.00 Actual Flexible Budget Quick Calculations for the CPA Exam DM Usage Variance Diff in Usage x Budg Price DM Price Variance Diff in Price x Actual Used or….. Diff in Price x Actual Purch
7800 units 7800 units DM - input 23,100 lbs 23,400 lbs - price $5.20 $5.00 DL - input 40,100 hrs 39,000 hrs - price $14.60 $15.00 VOH - rate $5.90 $6.00 Actual Flexible Budget Quick Calculations for the CPA Exam DL Usage Variance Diff in Usage x Budg Price DL Price Variance Diff in Price x Actual Used
Possible Causes of Variances DM Usage Variance $ 1,500 F DM Price Variance $ 4,620 U DL Usage Variance $16,500 U DL Price Variance $16,040 F
Understanding Variances • Unfavorable variances might indicate potential problems. • excessively high prices from suppliers • high defect rate • poor production scheduling • etc. • Favorable variances might indicate potential problems. • poor quality materials • workers lacking necessary skills • corners cut in production
Understanding Variances • Problems might be beyond the control of the production manager. • poor product design • rush orders causing congestion
Journal Entries to Record Variances Raw Materials (25,000 @ $5) A/P (25,000 @ $5.20) 125,000 5,000 130,000 Two ways of recording DM and DL • record DM and DL at actual cost (Chpt 3) • report variances in statements that compare actual to budget • record DM and DL at standard cost (Chpt 10) • record variances at time of transaction Standard cost Actual cost
WIP (7,800 x 3 lbs x $5 / lb) Raw Mater (23,100 x $5 / lb) WIP (7,800 x 5 hrs x $15 / hr) DL Price Variance Wages Pay. (40,100 x $14.60) DL Usage Variance 117,000 585,000 1,500 115,500 585,460 Standard usage Actual usage Standard usage and cost Actual usage and cost