Download
1 / 19
190 likes | 456 Views
Drawing Conclusions. Asking questions (for science) and defining problems (for engineering). Using mathematics and computational thinking. Engaging in argument from evidence. Planning and carrying out investigations. Developing and using models.

E N D
Asking questions (for science) and defining problems (for engineering) Using mathematics and computational thinking Engaging in argument from evidence Planning and carrying out investigations Developing and using models Obtaining, evaluating, and communicating information Constructing explanations (for science) and designing solutions (for engineering) Analyzing and interpreting data
Drawing Conclusions 1. Examine the question, data, and conclusion provided 2. Determine if the data presented supports the conclusions being made. If not, identify the problem(s). 3. Identify what conclusions could/should be made from this data to answer the question and/or what additional data we would need to draw this conclusion. 4. Brainstorm how can you support your students in coming to these conclusions and/or avoid making similar mistakes 5. Share your case study & findings with a partner
Case Studies -Drawing Conclusions Does the data presented support the conclusions being made? If not, what problem(s) exist? 2. What conclusions could/should be made from this data to answer the question and/or what additional data would you need to draw this conclusion? 3. How can you support your students in coming to these conclusions and/or avoid making similar mistakes?
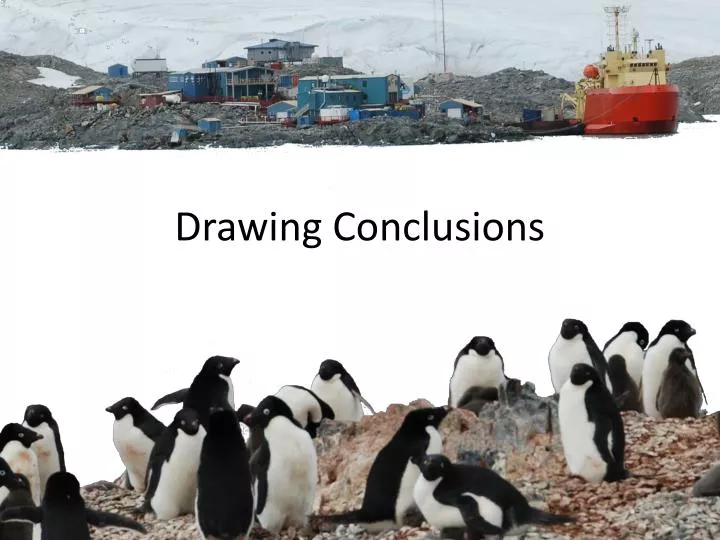
A Question: Are the Adelie penguin populations decreasing due to sea ice melting? Data: Conclusion: The melting of sea ice is causing a decrease in Adelie penguin numbers. We know this because the air temperature is increasing and the number of breeding pairs is decreasing.
B Question: What effect does pollution have on plant growth? Data: Conclusion: The Boston Fern grew less when watered with polluted water. Therefore, pollution will decrease the amount of plant life on Earth.
C Question: What effect does pollution have on plant growth? Data: Conclusion: When watered with polluted water, both fern species grew less. This shows that pollution has an impact on the growth of ferns.
D Question: What impact does weight have on maximum oxygen consumption during exercise? Data: Maximum oxygen consumption Weight (lbs) Conclusion: A person’s weight, which is related to the amount that a person exercises, does not impact maximum oxygen consumption. Therefore, exercising does not influence a person’s maximum oxygen consumption.
E Question: How does adding a bacterial starter culture impact the yogurt making process? Data: Table A – Observations for 230 minutes of whole milk + killed bacteria (starter culture) Table B – Observations for 230 minutes of whole milk + live bacteria (starter culture) Conclusion:During the process of making yogurt we used a lot of good bacteria such asLactobacillus. When heating the yogurt up we were allowing the heat to kill the live bacteria in the yogurt to make it healthier for us humans. For example, it is similar to a frozen hot pocket being heated in an oven. It is important to cook food all of the way or you could get sick from bacteria likeSalmonella.
F Question: What was the impact of Superstorm Sandy on large versus small trees in the Rutgers EcoPreserve? Data: Map of survey area and location on fallen trees. Each student group is represented by a different color. The lines are the path they took and the circles are the location of the fallen trees with information on their diameter. Conclusion: During Superstorm Sandy, many of the tree that fell were large. This is because they were older (probably at or around 100-150+ years old). Their roots are weak so they were easily pushed over versus smaller, younger trees with stronger roots.
G Question: Which sensor (the seabird, cast away, glider, or PASCO) is the most accurate for measuring the temperature and conductivity in the ocean? Data: Average Temperature (C) Conductivity (s/m) Conclusion: Conductivity and temperature are related, as one goes up, the other goes down. Therefore, all four sensors are accurate and can be used.
H Question: Has the climate changed over time in New Brunswick, NJ? Data: Conclusion: Climate change is impacting NJ. While the temperature goes up and down between the years, overall it has gone up from the late 1890s to today. This indicates that NJ is becoming warmer over time. The warming began around the time of the industrial revolution (about 1880 – 1890) when more carbon was being pumped into the air. Before that, the temperature was below 9.5C.
I Question: What controls where sharks go? Data: Temperature (°C) Day Conclusion: Sharks swim in waters that are at different temperatures. However, they spend most days in water temperatures that are above 10°C so they like warmer temperatures. This proves that temperature controls where sharks go.
J Question: How will increased carbon dioxide concentrations and temperature changes impact the growth of the saltwater clam (Mercenariamercenaria)? Data: Pre-Industrial Revolution Conditions: 73°F 250 ppm CO2 Extreme Future Conditions: 85°F 1500 ppm CO2 Estimated 2100 Conditions: 79°F 750 ppm CO2 Current Conditions: 74°F 390 ppm CO2 Conclusion: Changing temperature and increased carbon dioxide will impact the growth of calcifiers, like saltwater clams. When we increased the carbon dioxide concentrations and temperatures, we found the the size of the shell decreased. This proves that climate change will impact organisms that make shells.
K Question: How can we manage fisheries to make sure that there is enough fish for the future? Black Sea Bass Landing Data Data: Commercial landing Recreational landing Total landing Conclusion: Most of the fish were caught by recreational fisherman so we should restrict how much fish they can catch compared to commercial fisherman. Also, most of the fish caught were from 1981 to 1987. We should not let people fish at those levels. This will help to make sure that there are enough fish for everyone.
L Question: How does temperature impact growth rates of cacti? Data: Growth of the cactus in centimeters Conclusion: The cactus at room temperature grew much more than the one stored in the refrigerator. Therefore, cacti do not grow well at cold temperatures and cannot be grown in cold climates.
Common Mistakes • Incorrect assumptions and/or exaggerated inferences • Data and/or conclusion does not match the question being investigated • Missing data to support the conclusion • Misinterpretation of the results due to incorrect data visualization
Helping Students Draw Conclusions From Their Investigation • What can be learned from looking at the data? • Did what you change (independent variable) cause changes in the results (dependent variable)? • How does the data relate to your original hypothesis? • What changes in the experimental procedure (or design) would you make? • What are the possibilities for further study?