Download
1 / 21
210 likes | 294 Views
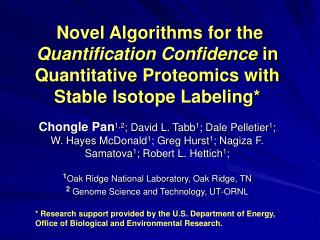
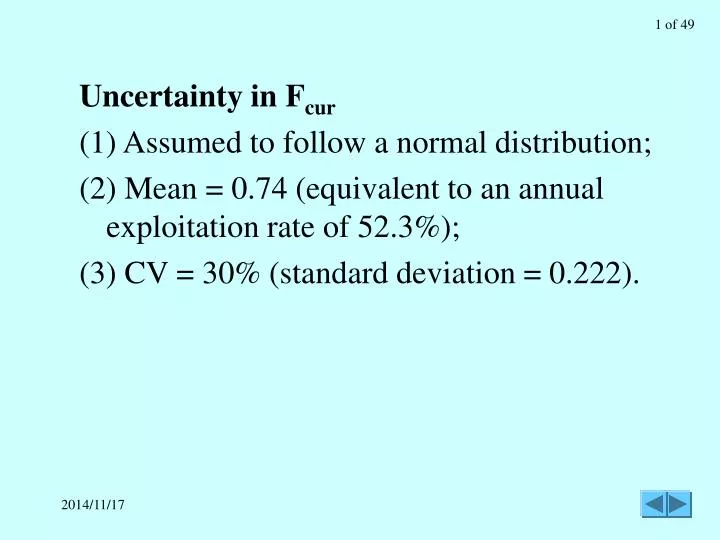
Uncertainty in F cur (1) Assumed to follow a normal distribution; (2) Mean = 0.74 (equivalent to an annual exploitation rate of 52.3%); (3) CV = 30% (standard deviation = 0.222). Moderate uncertainty (Scenario I). Non-random uncertainty in M (with other parameters follow scenario I). Summary

E N D
Uncertainty in Fcur • (1) Assumed to follow a normal distribution; • (2) Mean = 0.74 (equivalent to an annual exploitation rate of 52.3%); • (3) CV = 30% (standard deviation = 0.222).
Non-random uncertainty in M (with other parameters follow scenario I)
Summary • If uncertainty is considered, the determination of the stock status will be influenced by (a) magnitudes and nature of variations in parameters in the EPR model, (b) variation associated with current fishing mortality estimate; (c) the decision confidence level • Natural mortality has a greater impacts on the estimation of P(Fcur > F10%) than growth parameters, a higher natural mortality is likely to reduce the likelihood of defining the fishery as overfished, and vice versa. • Chen, Y. and C. Wilson. 2002. A simulation study to evaluate impacts of uncertainty on the assessment of American lobster fishery in the Gulf of Maine. Can. J. Fish. Aquat. Sci. 59: 1394-1403
Data • Fishery-dependent data • catch size composition, CPUE, landings, sex ratio, proportion of V-notched lobster • Fishery-independent data • Survey size composition, survey index, sex ratio, proportion of V-notched lobster
Biological data: • Growth data (tagging study): Size-specific molting frequency, size-specific increment/molt • Size-specific life-history and fishery processes • maturation, fecundity, gear selectivity, natural mortality • Environmental variables • temperature
Models • Population dynamics models • Growth model; • Stock-recruitment model • Catch at size model; • V-notching model; • Maturation model; • (2) Observation models • Size-at-catch • Fishery CPUE • Survey abundance index • Size-at-survey • Sex ratio • Proportion of V-notched lobsters
Growth model • Develop a growth transition matrix • (1) Individual-based approach • Probabilistic stepwise growth model • (2) Von Bertalanffy growth model
(2) Von Bertalanffy growth model • Fit modified von Bertalanffy growth model to size increment – days-at-large data • Estimate three parameters K and L • Assume growth increment at Lk, LLk N(LLk , k2) • Estimate expected growth increment LLk at Lk • Calculate probability of growing from Lk to other size classes
Dynamics models (1) Exploitation rate independent of size class
Dynamics models (2) Exploitation rate dependent of size class
Bayesian statistical estimator • Markov Chain Monte Carlo (MCMC) simulation • Hastings-Metropolis algorithm • Codes developed using AD Model Builder • Half a million simulations will be run
How stock assessment modeling works • A model fishery is generated using the models • The model fishery yields output including size composition of “catch” and “survey”, “fishery” CPUE, “survey” index, proportion of V-notched “lobster” and sex ratio observed in the “fishery” and “survey” • Using the Bayesian estimator to optimize the differences between model fishery outputs and data actually observed in the fishery and surveys • The optimization leads to the estimation of key fishery parameters that are required for the fishery management and risk analysis of alternative management strategies.
(3) Evaluation and comparative study • Using Monte Carlo computer simulation approach • Simulate a lobster fishery using series of random Bernoulli trials in computer simulation with known parameters • Apply the new and other assessment models to the simulated fishery • Compare the estimated parameters with the built-in parameters for different models
ENTER ith area Yes No Dies Naturally? Caught in fishery? Dies Naturally Record the size of the individual Is it legal? Dies from handing? Does it molt? Is it V-notched? Grows by how much? Need to be V-notched? V-notching Add to Spawning biomass Does it mature? Add to legal catch Move to which area?