Download
1 / 25
250 likes | 320 Views
GAP Mapping of Predicted Species Distributions: Perspectives on Issues of Statistical Inference. Gary J. Umphrey. Department of Mathematics and Statistics University of Guelph, Guelph, Ont., Canada N1G 2W1 3 August, 2002 Gap Analysis Program Meeting, Shepherdstown, WV.

E N D
GAP Mapping of Predicted Species Distributions: Perspectives on Issues of Statistical Inference Gary J. Umphrey Department of Mathematics and Statistics University of Guelph, Guelph, Ont., Canada N1G 2W1 3 August, 2002 Gap Analysis Program Meeting, Shepherdstown, WV
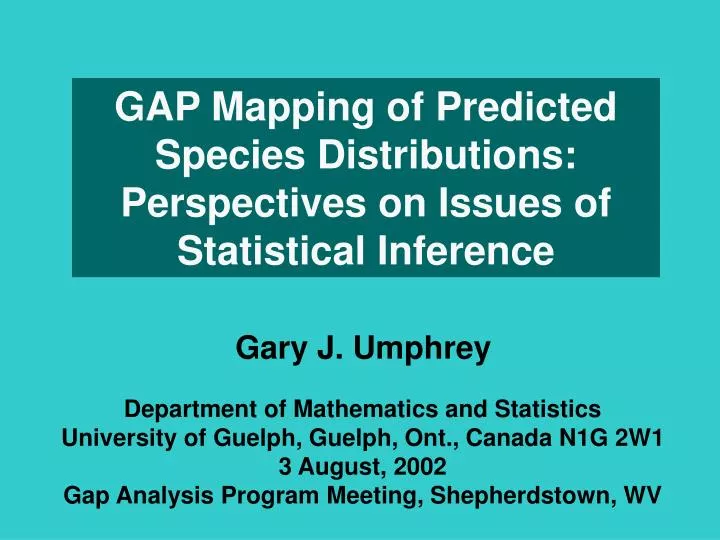
Green - predicted distribution of gila monster Blue - protected areas (Status 1 or 2)
GAP Modeling of Predicted Species Distributions: • Attempts to capture “all available information” to predict species occurrences. • Information sources quite varied; include species-habitat affinities, point locality records, range maps and expert opinion. • Land cover classification a key predictor; other predictors also condition model.
But how “scientifically valid” can GAP modelling be? • Sampling is biased, often blatantly so. • How best to combine different kinds of information appears nebulous. • It even uses “expert opinion” … but how expert are the experts, and wouldn’t a different group of experts give different opinions?
My objectives: • To explain why I consider GAP modeling to be inferentially sound. • To discuss the interpretation of probability for a dichotomous presence-absence species map. • To offer a few suggestions to guide future modeling and sampling.
Arthur P. Dempster (1987): “The accepted paradigm of statistical inference is to draw inferences from random samples to populations, emphasizing that only information in the sample is to be used. I argue that this paradigm is too narrow, in fact so narrow that technical statistics risks dismissal as insufficiently relevant to science, even in situations where the main task is to draw uncertain inferences from samples to populations.” In “Probability and the Future of Statistics” in MacNeill & Umphrey (eds), Foundations of Statistical Inference, Reidel.
Dempster suggests thatR. A. Fisher’s concept of Mathematical Probability “permits the exact reasoning of mathematics to be applied to the fundamentally inexact topic of uncertainty”.
How to lay a fair bet: • Suppose your model predicts the occurrence of a species in the “presence” area with a probability of 0.30 for a random spatiotemporal sampling unit of fixed size. • You let someone (a skeptic?) bet either side -- you take the opposite side.
How to lay a fair bet (2): • Whoever bets on “absence” must put up 7/3 times the wager of the person who bets “presence”. • For example, if the wager for choosing “absence” is $7, the fair wager for “presence” if the model is correct is $3. • Expected winnings are $0 for each person – you should break even (in the long run).
How to lay a fair bet (3): • But choosing absence when the probability of absence is really 0.40 gives expected winnings of (7)(0.40) + (3)(0.60) = $1.
An analogy: How does a blind person gather information to recognize a face by touch?
What do face recognition and mapping have in common? • Both seek information on an objective reality; probability model can be calibrated and tested.
The logistic model is:P(x) = eα + βx/(1 + eα + βx),−∞ < x < ∞, −∞ < α < ∞, β > 0 An S-Shaped Curve
Spatial Probit Analysis • Calibrate size of sampling unit required to have a k% chance of species occurrence. • Methods of probit analysis are extensively investigated. • Allows flexibility for different kinds of biodiversity assessments e.g. for reserve selection vs biodiversity impact in nonreserve areas.
Could Karen Dvornich make a lot of money with NatureMapping? It depends …
Summary (1) • Fisher’s concept of Mathematical Probability puts GAP modeling on an inferentially sound basis. • Improving a map involves increasing the difference in occurrence probabilities between areas of presence and absence for a fixed-size sampling unit, subject to omission and commission error costs. • BUT allocating sampling resources to maximize the difference may not be best.
Summary (2) • Amount of change and effort required are measures of map quality. • GAP maps should never be obviously wrong (same does not hold for ecological models). • GAP projects need to be ongoing if maps are to be improved and calibrated.