Download
1 / 27
270 likes | 368 Views
Traditional Norm-Reference Testing. Chapter 4. Florida Memorial University Ms. Yohana Lopez. Table of Content. Council for Exceptional Children (CEC) Standards 1 Council for Exceptional Children (CEC) Standards 2 Introduction to Basic Measurement Concept Distributions

E N D
Traditional Norm-Reference Testing Chapter 4 Florida Memorial University Ms. Yohana Lopez
Table of Content Council for Exceptional Children (CEC)Standards 1 Council for Exceptional Children (CEC)Standards 2 Introduction to Basic Measurement Concept Distributions Measures of Central Tendency 1 Measures of Central Tendency 2 Measure of Variability Measure of Variability Normal Distribution of Scores Normal Distribution of Scores Standard Error of Measurement and Confidence Intervals
Table of Content • Types of Scores on NRTs • Percentile Scores • Standard Scores • Developmental Scores • Technical Consideration in Selecting an NRTs • Reliability • Validity • Appropriateness of Test Norms • Administration, Scoring, and Interpretation of Norm-Reference Tests • Communication Assessment Findings • Outline for an Assessment Report • The Role of Traditional Norm-Referenced Testing in the RTI Framework • Question
Council for Exceptional Children (CEC)Standards This chapter introduces the reader to essential measurement concepts that assist in selecting, administering, scoring, and interpreting test data and in understanding the technical qualities of NRTs. (CEC) Standards: ICC8K1 - Basic Terminology used in assessment. GC8K1 - Specialized terminology used in assessment of individuals with disabilities. ICC8S1 - Rather relevant background information ICC8S2 – Administer nonbiased formal and informal assessments.
Council for Exceptional Children (CEC)Standards • ICC8S5 – Interpret information from formal and informal assessment. • ICC8S6 – Use assessment information in making eligibility, program, and placement decisions for individuals who have exceptional learning needs, including those from culturally and / or linguistically diverse backgrounds. • ICC87 – Report assessment results to all stakeholders using effective communication skills. • ICC8S10 Create and maintain records • GC8S2 – Use excepcionality-specifix assessment instruments with individuals who have disabilities.
Introduction to Basic Measurement Concept Measurement concept provides with the psychometric qualities of NRTs. The psychometric variables are very important for educational professionals so they may correctly interpret test scores and effectively communicate their findings to students, their families, and other school professionals.
Distributions A distribution shows how a number of participants performed individually on the test. This is a compilation of raw score earned by a group of test takers. This scores can be represented as a list of scores, in a table, or graphically in the form of charts and graphs to demonstrate the spread of the scores within a group. A frequency distribution displays the number of participants who earned a particular test score.
Measures of Central Tendency The average performance of individuals on a test can be determined using measures of central tendency, including the mode, median, and mean. A frequency table shows the distribution or number of students who achieved a particular score on the reading test. In Example 1, three students achieved a score of 17.
Measures of Central Tendency A frequency graph also shows the distribution or number of students who achieved a particular score.
Measure of Variability This measure tell us about the spread of scores around the average score in a distribution. Mean – The average score in a frequency distribution. In previous example, the mean score is 21.5. (Abbreviations for the mean are M if the scores are from a sample of participants and μ if the scores are from a population of participants.) Median – The score in the middle of frequency distribution, or the score at the 50th percentile. In previous example, the median score is 21. Mode – The score that occurs most frequently in the distribution. In previous example, the mode is 17.
Measure of Variability Range – The difference between the highest and lowest score in the distribution. In previous example, the range is 12. Standard Deviation – A measure of how much the scores vary from the mean. In the sample, the standard deviation is 3.76, indicating that the average difference between the scores and mean is around 4 points. The higher the standard deviation, the more different the scores are from one another and from the mean. (Abbreviations for the standard deviation are SD if the scores are from a sample and Σ if the scores are from a population.) In Example 1, a raw score of 27 has a standard score of +1.46 (27 – 21.5 / 3.76). This indicates that a score of 27 is 1.46 standard deviation units above the mean. A raw score of 19 has a standard score of –.66, indicating that it is .66 standard deviation units below the mean.
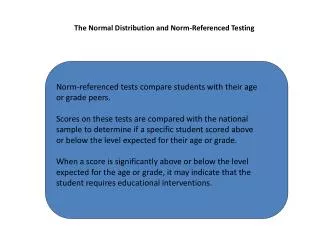
Normal Distribution of Scores The normal probability curve refers to a frequency distribution in which the graph of scores resembles a bell — hence, the famous bell-shaped curve. Many human traits such as intelligence, personality scores and student achievement have normal distributions. Not all distributions are normal, sometimes are skewed. Example: If all adults in the state of Florida were given a general intelligence test, the frequency distribution of the scores would resemble the following bell-shaped curve.
Standard Error of Measurement and Confidence Intervals The Standard Error of Measurement (SEM), is the statistic that estimate the range of scores that a student might earn if he were to take the same test on multiple occasions. A Confidence Interval is a range of scores within which it is highly likely that the individual’s true score will lie.
Types of Scores on NRTs Raw scores is the number of items a student answers correctly without adjustment for guessing. For example, if there are 15 problems on an arithmetic test, and a student answers 11 correctly, then the raw score is 11. Raw scores, however, do not provide us with enough information to describe student performance. A raw score on an NRTs are converted to derived scores to facilitate interpretation. This scores include scores of relative standing such as Percentile and Standard Scores.
Percentile Scores • A Percentile is a score that indicates the rank of the score compared to others (same age or same grade), using a hypothetical group of 100 students. • A percentile of 25, for example, indicates that the student's test performance equals or exceeds 25 out of 100 students on the same measure; a percentile of 87 indicates that the student equals or surpasses 87 out of 100 (or 87% of) students. • Percentiles are derived from raw scores using the norms obtained from testing a large population when the test was first developed. • Percentiles are probably the most commonly used test score in education.
Standard Scores Is also derived from raw scores using the normed information gathered when the test was developed. Instead of reflecting a student's rank compared to others. Indicate how far above or below the average (mean) an individual score falls, using a common scale, such as one with an "average" of 100. Take "variance" into account, or the degree to which scores typically will deviate from the average score. Can be used to compare individuals from different grades or age groups because all scores are converted to the same numerical scale. Most intelligence tests and many achievement tests use some type of standard scores.
Developmental Scores Are scores that have been transformed from raw scores and reflect the average performance at age and grade levels. These are raw scores obtained on NRTs and can be converted to age or grade equivalents to facilitate comparisons with other students of the same age or grade level as the target student. Developmental scores can be useful because Parents and professionals easily interpret them and place the performance of students within a context.
Technical Consideration in Selecting an NRT Teachers must consider three critical elements when they are evaluating the technical equalities of any test. These elements include: The Reliability The Validity The appropriateness Of the normative sample test.
Reliability Reliability refers to the consistency of a measure. A test is considered reliable if we get the same result repeatedly. For example, if a test is designed to measure a trait then each time the test is administered to a subject, the results should be approximately the same. Unfortunately, it is impossible to calculate reliability exactly, but it can be estimated in a number of different ways: Test-Retest Reliability Alternate forms reliability Internal consistency reliability Interrater reliability • Factors that Influence the Reliability of the Test • Type of Test • Test Length • Test – retest time interval • Controlling random error • SEM
Validity Validity is the extent to which a test measures what it claims to measure. It is vital for a test to be valid in order for the results to be accurately applied and interpreted. Validity isn’t determined by a single statistic, but by a body of research that demonstrates the relationship between the test and the behavior it is intended to measure. There are four types of validity: Face Validity Content Validity Criterion – related validity Construct validity
Appropriateness of Test Norms It is very important to review the sample on which the test was originally standardized. This preview allows the test user to determine whether or not is adequate to be applied to individuals who share common characteristics with the target students and weather thee are the adequate number of individuals in the norm group who share these traits as the sample you will be testing.
Administration, Scoring, and Interpretation of Norm-Reference Tests Preparation of the examiner Reviewing the student’s records Interviewing the student’s family, former teacher, and other school professionals Observing the student Preparation of the Testing Environment Quite and free from distractions and comfortable furniture Provide necessary test supplies needed. E.g., manuals, calculators, test record booklets, etc. Lightening and temperature appropriate. Preparation of the Student Should be restful and intake the appropriate medication and the respective meal A familiar location to the student to avoid disturbances, anxiety, and maximize performance
Communication Assessment Findings Assessment data is shared with the student and the family orally, in a face to face meeting, and followed by a written report. The team members should be respectful of the family needs. The student should be encourage to participate and may be given a role. A draft of the written report should be presented to the family for their input before the report is finalized. The report should be written professional and should be readable by different audiences. An outline for a written assessment report follows.
Outline for an Assessment Report These are recommended components of an assessment report (Sattler, 1992) Identifying information Reason for the referral Observation during assessment Present levels of performance Summary Implications of the assessment findings Signatures
The Role of Traditional Norm-Referenced Testing in the RTI Framework Traditional norm-reference testing continue to have a place in the RTI framework. Schools may choose use NRT’s As screening measure to determine which students are struggling in various academic areas I order to identify the students who will receive intervention. Will continue to be used as part of the psychoeducational evaluations that is conducted to rule out various reasons for the lack of responsiveness To evaluate the students using cognitive, processing, memory, language, behavior, motor skills, and other measures to determine the nature of his or her disability.
Question In what ways are NRTs used in an RTI Framework?