Download
1 / 34
340 likes | 452 Views
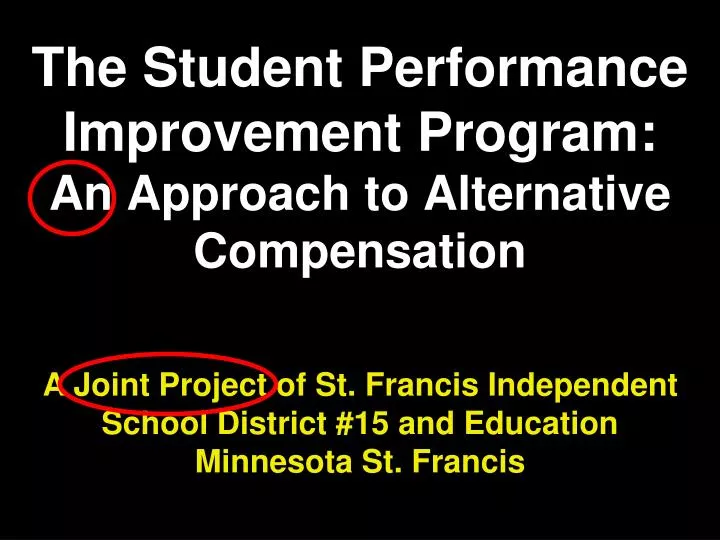
The Student Performance Improvement Program: An Approach to Alternative Compensation. A Joint Project of St. Francis Independent School District #15 and Education Minnesota St. Francis. “It was the overnight success that took ten years to build.”.

E N D
The Student Performance Improvement Program:An Approach to Alternative Compensation A Joint Project of St. Francis Independent School District #15 and Education Minnesota St. Francis
“It was the overnight success that took ten years to build.” Joe Fredrickson, St. Francis Middle School Science Teacher – quoted in American Teacher magazine, February 2011
Timeline 1991 – 1995: 1991 – Members of the St. Francis Federation of Teachers vote to authorize a strike 1992 – Settlement reached without a strike but members are clearly unhappy with the outcome 1992 – New president and new negotiating team elected 1993 – For first time in history of district, contract settlement reached prior to the beginning of the school year 1995 - Minnesota begins 2% set aside for professional development
Timeline 1997 – 2003: 1997 - St. Francis negotiates teacher teams, leaders, 20 hours of individual professional time 2000 - Chief negotiator, union vice president attend ER&D training, write what becomes Teacher Academy policy 2001 - District starts Teacher Academy, Gov. Ventura provides $$ for five model alternative compensation programs 2002 - Tim Pawlenty elected governor 2003 - Minnesota provides no increase in education funding for two year period, state senate (controlled by Democrats) propose an increase all tied to performance-based pay
Timeline 2004 – 2005: 2004 - St. Francis union executive council endorses a plan to pursue performance-based pay as “most likely means to significantly increase teacher pay,” 54% of teacher leaders endorse the concept 2005 - (March) 70% of St. Francis teachers vote to take performance-based plan to board during negotiations 2005 - (July) State legislature approves Q Comp, Governor signs law 2005 - (September) 85% of St. Francis teachers vote “yes” for performance-based pay plan 2005 - (October) St. Francis Plan accepted by State, goes into effect
Sue Redfield Teacher Negotiating Team Paula Jesberg Jeff Fink, Randy Keillor, Carol Saba, Gary Sederstrom Joyce Newman Vicki Cronin Kim Hirsch Sandy Grams Troy Ferguson School Board Chair Timeline, 1997-2005 Nancy Rajanen Jay Reker Director of Human Resources Stan Tikkanen Bob Dell Mae Hawkins Director of Financial Affairs Jim Smith Mike Wyatt Ed Saxton Superintendent 1997 1999 2001 2003 2005
Teacher Academy:Purpose • It is the purpose of the ISD #15 Teacher Academy to increase student learning in every classroom in the district by providing each teacher with the support and tools to maximize his or her effectiveness as a teacher and encourage professional growth throughout the teacher's career.
ISD #15 Teacher Academy Program Overview
St. Francis Student Achievement, Compared to the State Average... Increased by an average of +12.81point average gain in mathematics +10.15point average gain in reading (Comparing the base years 1998-2000 to full implementation years 2002-2005)
Independent School District #15 BST Mathematics Results - 2005 Comparisonto Bordering Districts Reported as percent passing test in 8th grade.
Independent School District #15 BST Reading Results - 2005 Comparisonto Bordering Districts Reported as percent passing test in 8th grade.
Independent School District #15BST Writing Results - 2007 Comparison (10th Grade)to Bordering Districts Reported as percent passing test in 10th grade.
St. Francis Graduates Increasing College Access Baseline (2000) - 59.6% of graduates go on to college. Average of full implementation years (2002-2006) - 70.4% of graduates go on to college.
Minnesota’s Quality Compensation (Q Comp) Law • Voluntary program - districts, schools, and charter schools must apply • Provides $260 per pupil for designated purposes (for St. Francis about 7% increase in money available for teacher salaries) • Provides for a four-year contract or MOU • Five components - • Career ladder for teachers • Job embedded staff development • Teacher evaluation (observation) system • Performance pay (standardized test bonus) • Reformed steps & lanes
Key Understandings – St. Francis Q Comp (SPIP) Plan • Beginning teacher salary increased by 20% • Teacher advancement based on attainment of positive annual reviews • Teacher reviews completed by a team that includes the teacher, two peers, and an administrator (Performance Review Team) • Each annual review based on • 4 observations • Teacher-generated evidence of student growth • Salary increases: • Annual cost-of-living increases as negotiated • Performance increases come after each three years of positive annual reviews • Completion of mentor training & attaining a Master’s degree • Career ladder provides leadership roles for 20% of staff with stipends and expedited movement through schedule
Performance Review Team (PRT) Assigned Spring/Summer PRT Reviews Work / Reports Results (PRT Meets) (Spring) Annual Review Processfor Individual Teachers Formal Observations / Evidence of Student Growth (November - May) Annual Program Developed (PRT Meets) (Summer/Fall) Professional Growth (Summer/school year)
Salary Schedule (2009-11) Extended Responsibility Stipends Range - $1,100 to $12,000
Teacher Career Paths Emerging Professional Teacher 6 annual reviews at proficient level (minimum) Professional Teacher Mentor Teacher Teachers eligible after 7 annual reviews Approved Master’s Degree Program Completed Career Classroom Performance Teachers eligible with 10 annual reviews, 7 of which are “established” Career Ladder in Teacher Leadership Teachers eligible with 7 annual reviews, 4 of which are “established”
University of Minnesota Center for Applied Research and Educational Improvement StudyAugust 2007 - June 2008,Presented to the School Board August 11, 2008
U of M CAREI StudyWhat Attracts New Teachers to St. Francis?* 33% - Teacher Support System 32% - Improved Salary Schedule 24% - Early hiring decision 11% - Other *Survey given to new teachers hired in 2006 & 2007.
U of M CAREI StudyIs St. Francis attracting more applicants for teaching jobs?* 70% - Agree St. Francis is attracting more applicants 18% strongly agree 51% agree *Survey given to administrators and teacher-leaders.
U of M CAREI StudyIs St. Francis attracting better applicants for teaching jobs?* 75% - Agree St. Francis is attracting better applicants 18% strongly agree 57% agree *Survey given to administrators and teacher-leaders.
U of M CAREI StudyAre new teachers more interested in staying in St. Francis?* 88% - Agree new teachers more interested in staying in St. Francis 43% strongly agree 45% agree *Survey given to administrators and teacher-leaders.
U of M CAREI StudySupport for the Q Comp system* 88.9% - Highly support system 79% - Believe salary advancement should be connected to student achievement gains 82% - Believe system will result in greater achievement gains for students *Survey given to all teachers.
U of M CAREI StudySummary & Conclusions Substantial and positive effects on Professional development Culture of the district Evaluation system Benefits from support at all levels including the School Board, superintendent, teachers’ union, school administrators, and teachers Student Performance Improvement Program is and will remain the professional development model for the district.
U of M CAREI StudySummary & Conclusions Most significant change - explicit link between professional development and positive, observable changes in work settings Professional staff members challenged to set goals personal based in research on best practices
U of M CAREI StudySummary & Conclusions Teachers demonstrate proficiency in attaining goals through observations by peers and administrators during the four classroom visits Link between professional development and professional behavior provides catalyst for permanent and positive change
U of M CAREI StudySummary & Conclusions Improved professional development - Increased reflective practice Teacher growth objectives observed & assessed Increased understanding of various roles (teacher, social worker, educational assistant, administrator) Process is clear, not overly rigid or prescriptive
U of M CAREI StudySummary & Conclusions Transformed professional culture of the district Common language for district staff Increased opportunities for collaboration Increased risk-taking with new instructional techniques & strategies Increased value of observations for both observer and teacher observed Important factor in attracting and retaining high quality staff
U of M CAREI StudySummary & Conclusions Strengthened the evaluation process Observation process provides for teachers to develop new skills work on challenges adjust behaviors in a timely manner Extended teacher duties increases leadership capacities of young teachers Become “catalysts for continued momentum and change” Student performance in both reading & math improved
By 2008, St. Francis students, grades 5-9, were scoring one full year (or more) above the national average in math. NATIONAL AVERAGE Page 18
NATIONAL AVERAGE Pages 19
Take Away A system that is indifferent to the performance of its employees and rewards them alike regardless of effort or effectiveness is based on an assumption that what those employees do really isn’t very important or difficult.